Qwen3.8-Flash-Next on a 64 GB M2 Ultra: A 66-Minute Real Work Run
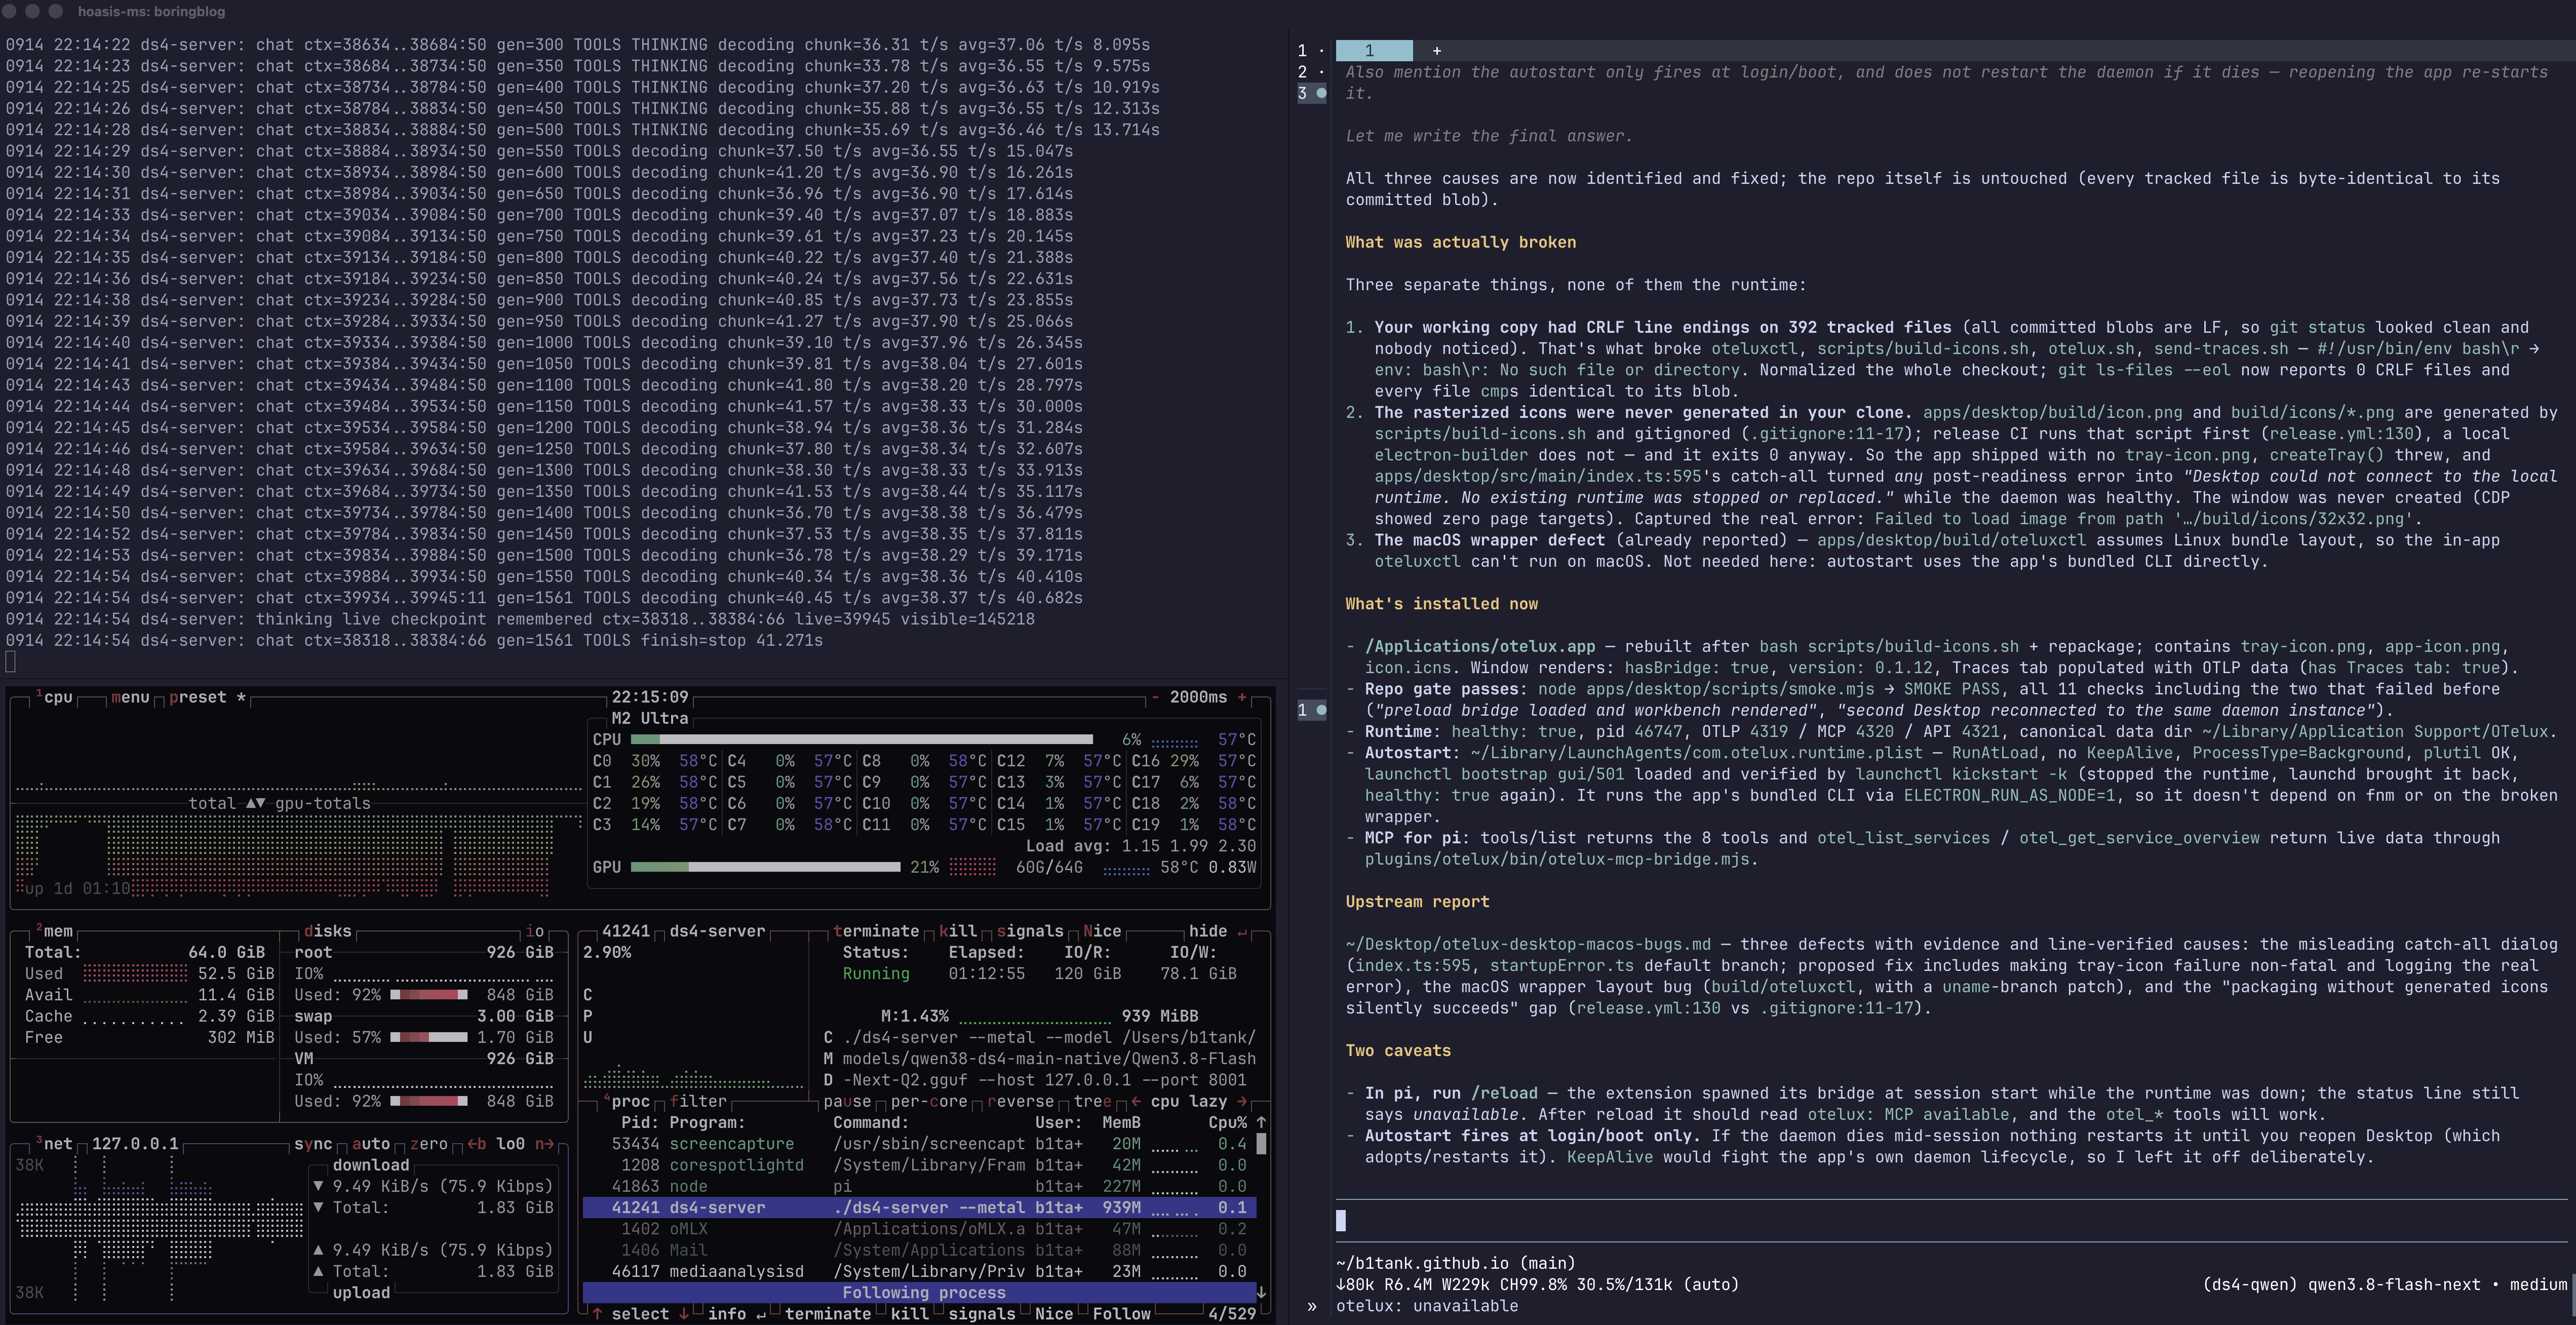
Qwen3.8-Flash-Next proved genuinely usable for real work on my 64 GB M2 Ultra. In a 66 min Pi session, it made 106 tool calls, averaged 35.5 tok/s during generation with MTP enabled, and finished the job. Pi automatically compacted the conversation at 114,950 tokens within a configured 128K window, about 54 min into the session, then continued. My Mac remained responsive enough for normal activity throughout.
The task was to investigate OTelux (a local-first OpenTelemetry workbench I had created and used on Linux but never properly tested on macOS). The session did not build it from scratch; it addressed the real packaging, runtime, UI, MCP, and autostart gaps required to make the existing prototype work on my Mac.
The most noticeable inference pauses came from long-context recovery. Rebuilding the resumed session and compacting near the limit took minutes, but both completed successfully and felt tolerable in this long-running session.
This is the real-world follow-up to How Far Can a 64 GB M2 Ultra Push Local LLMs?. That post measured what could fit and how fast it ran. This one shows that the setup can complete a messy, sustained coding task.
The setup
Machine
| Component | Specification |
|---|---|
| Computer | Mac Studio (Mac14,14) |
| Chip | Apple M2 Ultra |
| CPU | 24 cores: 16 performance, 8 efficiency |
| GPU | 60 cores |
| Unified memory | 64 GB |
| Internal storage | Approximately 1 TB SSD |
| Operating system | macOS 26.6.2 |
Model and DwarfStar
I used DwarfStar commit 9139e2a with its self-contained Qwen3.8-Flash-Next Q2 file:
Qwen3.8-Flash-Next-Q2.gguf
File size:          137.10 GiB
Resident weights:   41.72 GiB
BF16 n-grams:        95.37 GiB, read from SSD only
This Q2 release uses mixed precision, including IQ2_XXS gate/up experts and Q2_K down projections—not uniformly 2-bit weights. The runtime reads selected BF16 n-gram rows from disk rather than loading the entire 137 GiB file into RAM.
The full command, verified from the still-running process whose PID and start time matched the screenshots, was:
./ds4-server \
  --metal \
  --model ~/models/qwen38-ds4-main-native/Qwen3.8-Flash-Next-Q2.gguf \
  --host 127.0.0.1 \
  --port 8001 \
  --ctx 131072 \
  --tokens 8192 \
  --prefill-chunk 1024 \
  --mtp \
  --kv-disk-dir ~/.ds4/qwen38-server/kv \
  --kv-disk-space-mb 8192
The startup log reported the effective runtime configuration:
| Setting | Value |
|---|---|
| Context allocation | 131,072 tokens |
| Prefill chunk | 1,024 tokens |
| Disk KV-cache budget | 8,192 MiB |
| KV memory | 4.17 GiB |
| Other context buffers | 1.11 GiB |
| Total planned memory | 47.00 GiB |
| Backend | Metal |
| MTP | Enabled (--mtp) |
The generation rates below are from an MTP-enabled run, not an ordinary-decoding baseline. I did not enable --mtp-timing, so this log does not provide draft-acceptance statistics or establish a speedup over MTP off.
Pi
I ran Pi 0.85.1 with medium reasoning. Its local OpenAI-compatible provider pointed to http://127.0.0.1:8001/v1, advertised a 131,072-token context window, and allowed up to 8,192 output tokens per response.
Pi’s automatic compaction was enabled with its normal behavior: preserve recent work, summarize older history, rebuild the active context, and continue the same agent run.
The session at a glance
| Metric | Result |
|---|---|
| Elapsed session time | 1:05:46 |
| Messages | 225: 7 user, 112 assistant, 106 tool results |
| Tool calls | 106; six results flagged as errors |
| Tool mix | 95 shell-tool attempts, 6 reads, 3 writes, 2 edits |
| Output tokens | 79,572 |
| Cumulative input accounting | 6,591,647 tokens |
| Cache reads | 6,362,851 tokens (96.5%) |
| Prefilled tokens, including reprocessed context | 228,796 tokens |
| Weighted prefill throughput | 401.7 tok/s |
| Weighted decode throughput | 35.5 tok/s |
| Median completed-response decode | 36.6 tok/s |
The 66 min includes user pauses, tool execution, builds, the Pi restart, and compaction—not continuous inference. Across 113 completed server requests, prefill throughput is 228,796 tokens ÷ 569.635 sec; generation throughput is 79,572 tokens ÷ 2,239.721 sec of logged decoding time. Output includes reasoning, tool-call text, final answers, and compaction generation—not 80K tokens of finished code.
The 6.59 million input tokens are cumulative request accounting, not unique content or one giant prompt. Cache reads account for 96.5%; the 228,796 prefilled tokens include context reprocessed after cache misses and summarization.
The agent also made recoverable mistakes: one call used nonexistent Bash instead of bash, and an exact-text edit failed. The result was successful recovery, not a flawless tool sequence.
The 66-minute journey
It started as an unavailable Pi tool
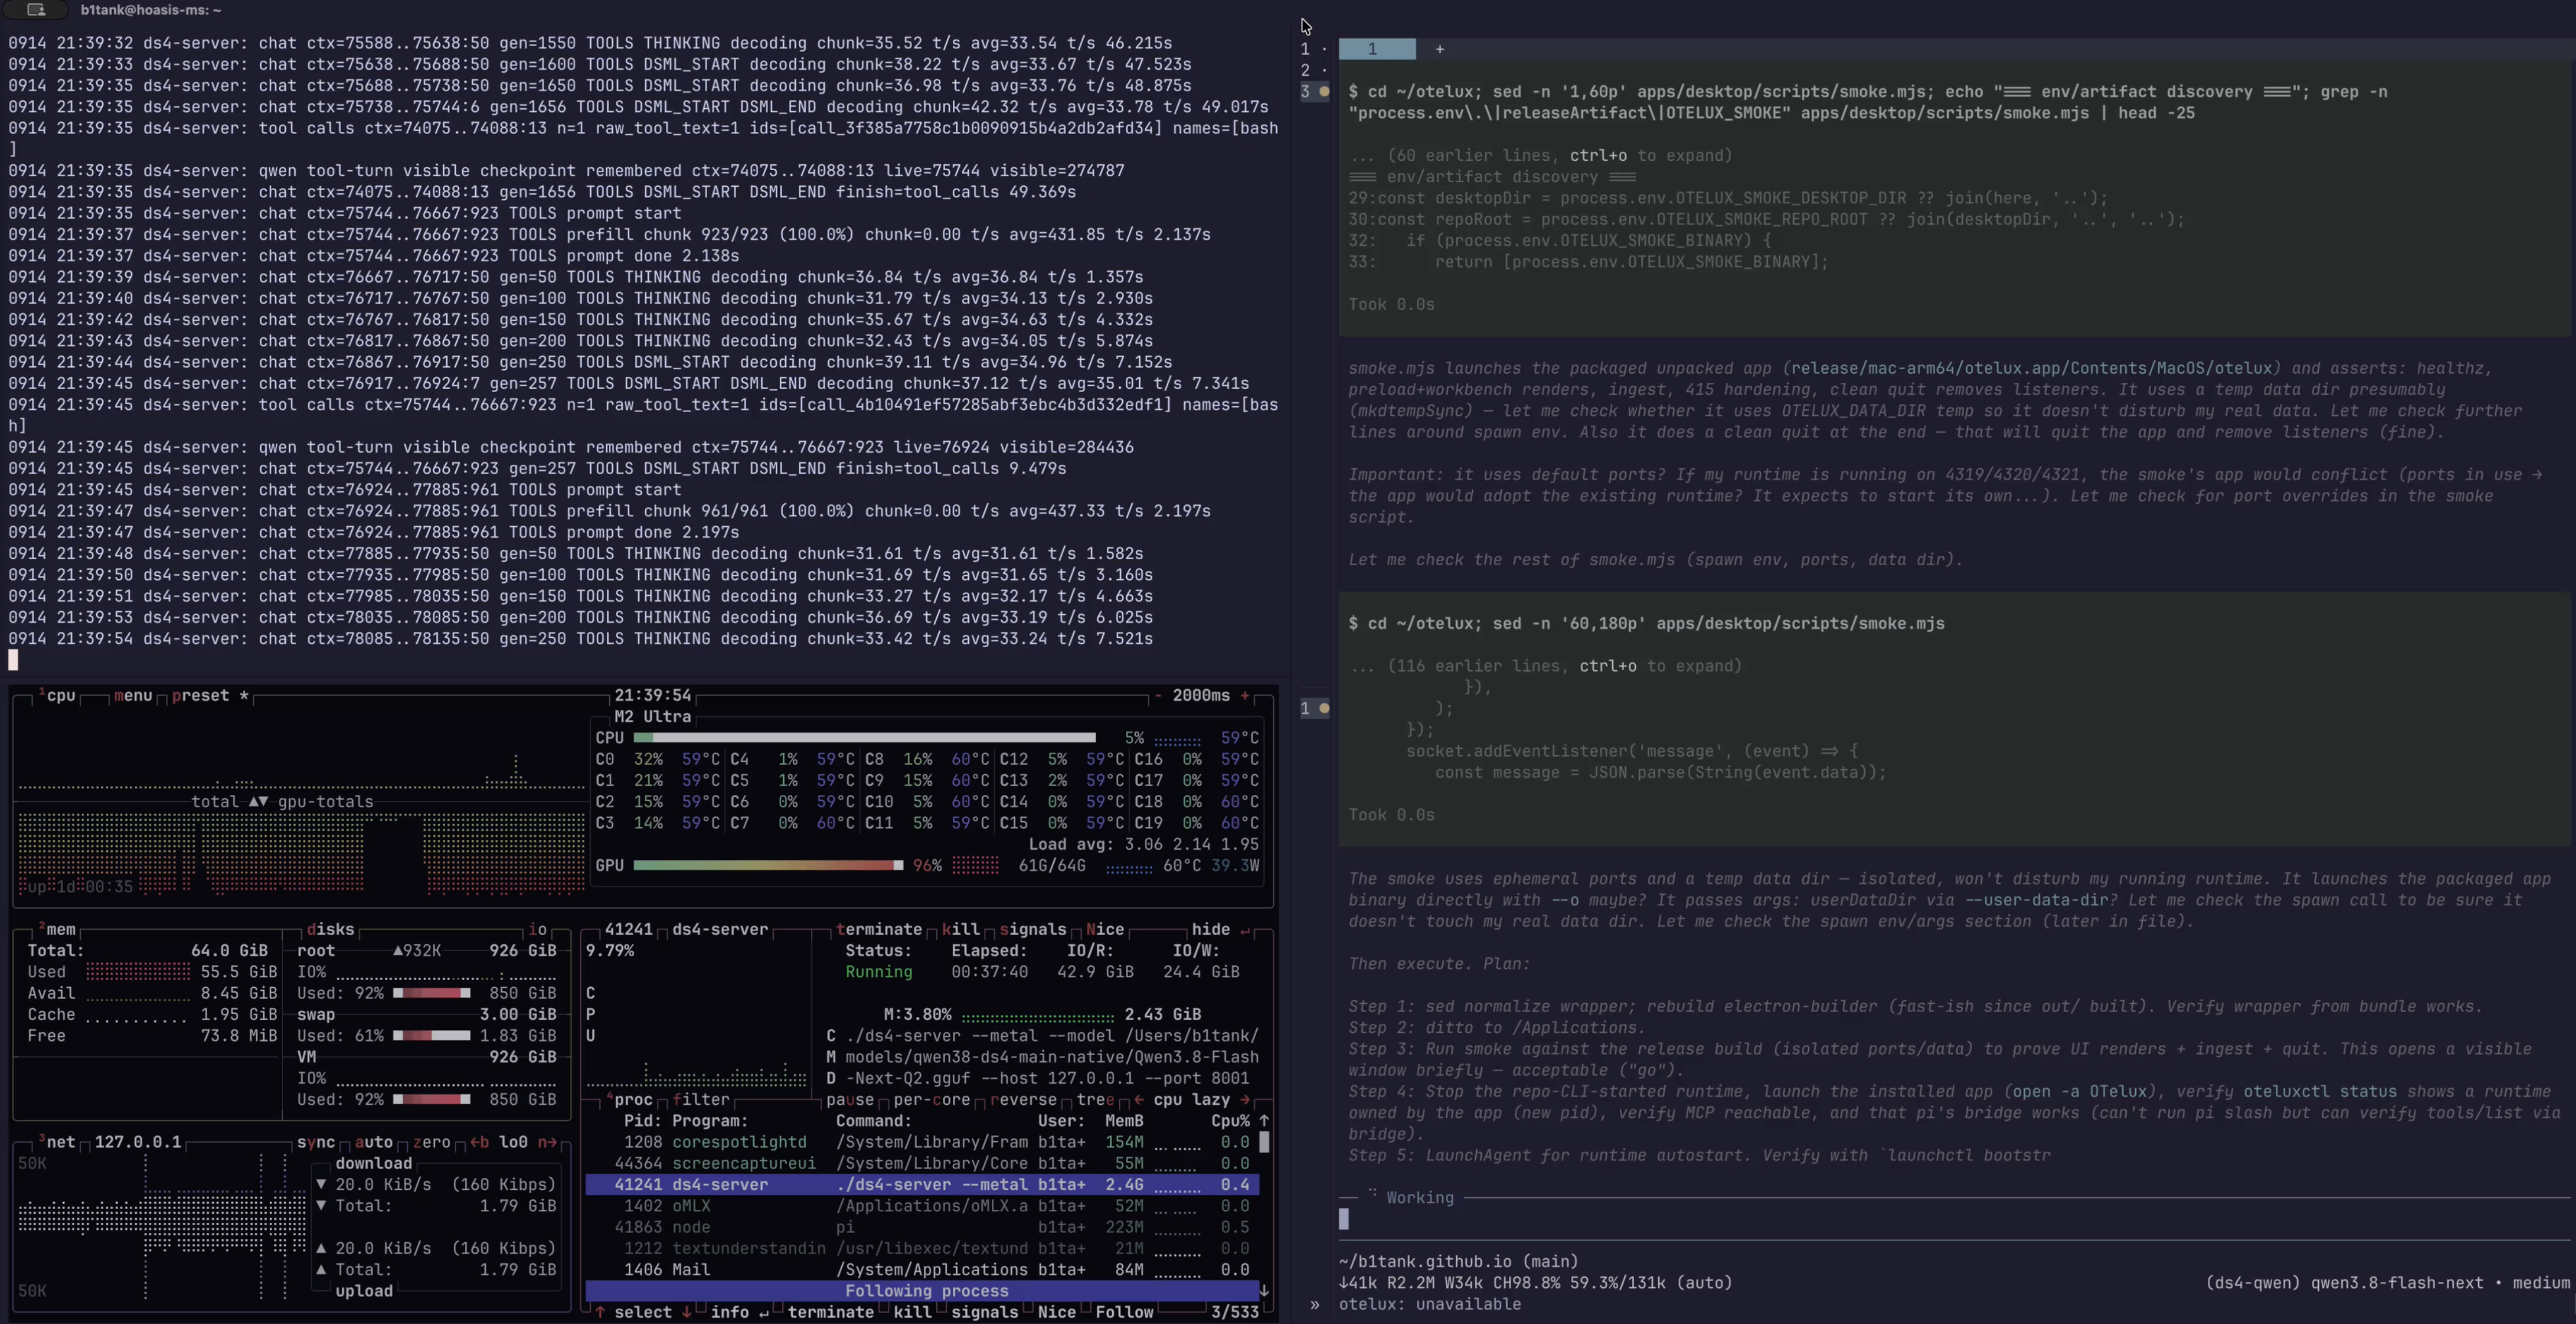
My first question was why the installed OTelux package appeared unavailable in Pi. The model established that the package and its skills were installed correctly. The missing piece was the local OTelux runtime: Pi’s extension was trying to reach its MCP endpoint, but nothing was listening.
From there, the task expanded. I wanted OTelux properly installed on my Mac so opening the app would bring up the runtime and UI, Pi could use its MCP tools, and the runtime could start after login.
A local macOS build worked, then the app did not
The model inspected OTelux’s build and release paths, built its Electron desktop app for Apple Silicon, produced a local DMG and app bundle, and installed it into /Applications.
Then the app displayed a misleading error: “Desktop could not connect to the local runtime.” That became the real debugging task. The agent checked the daemon, package layout, preload bridge, renderer, smoke scripts, generated assets, and launch behavior instead of accepting the dialog at face value.
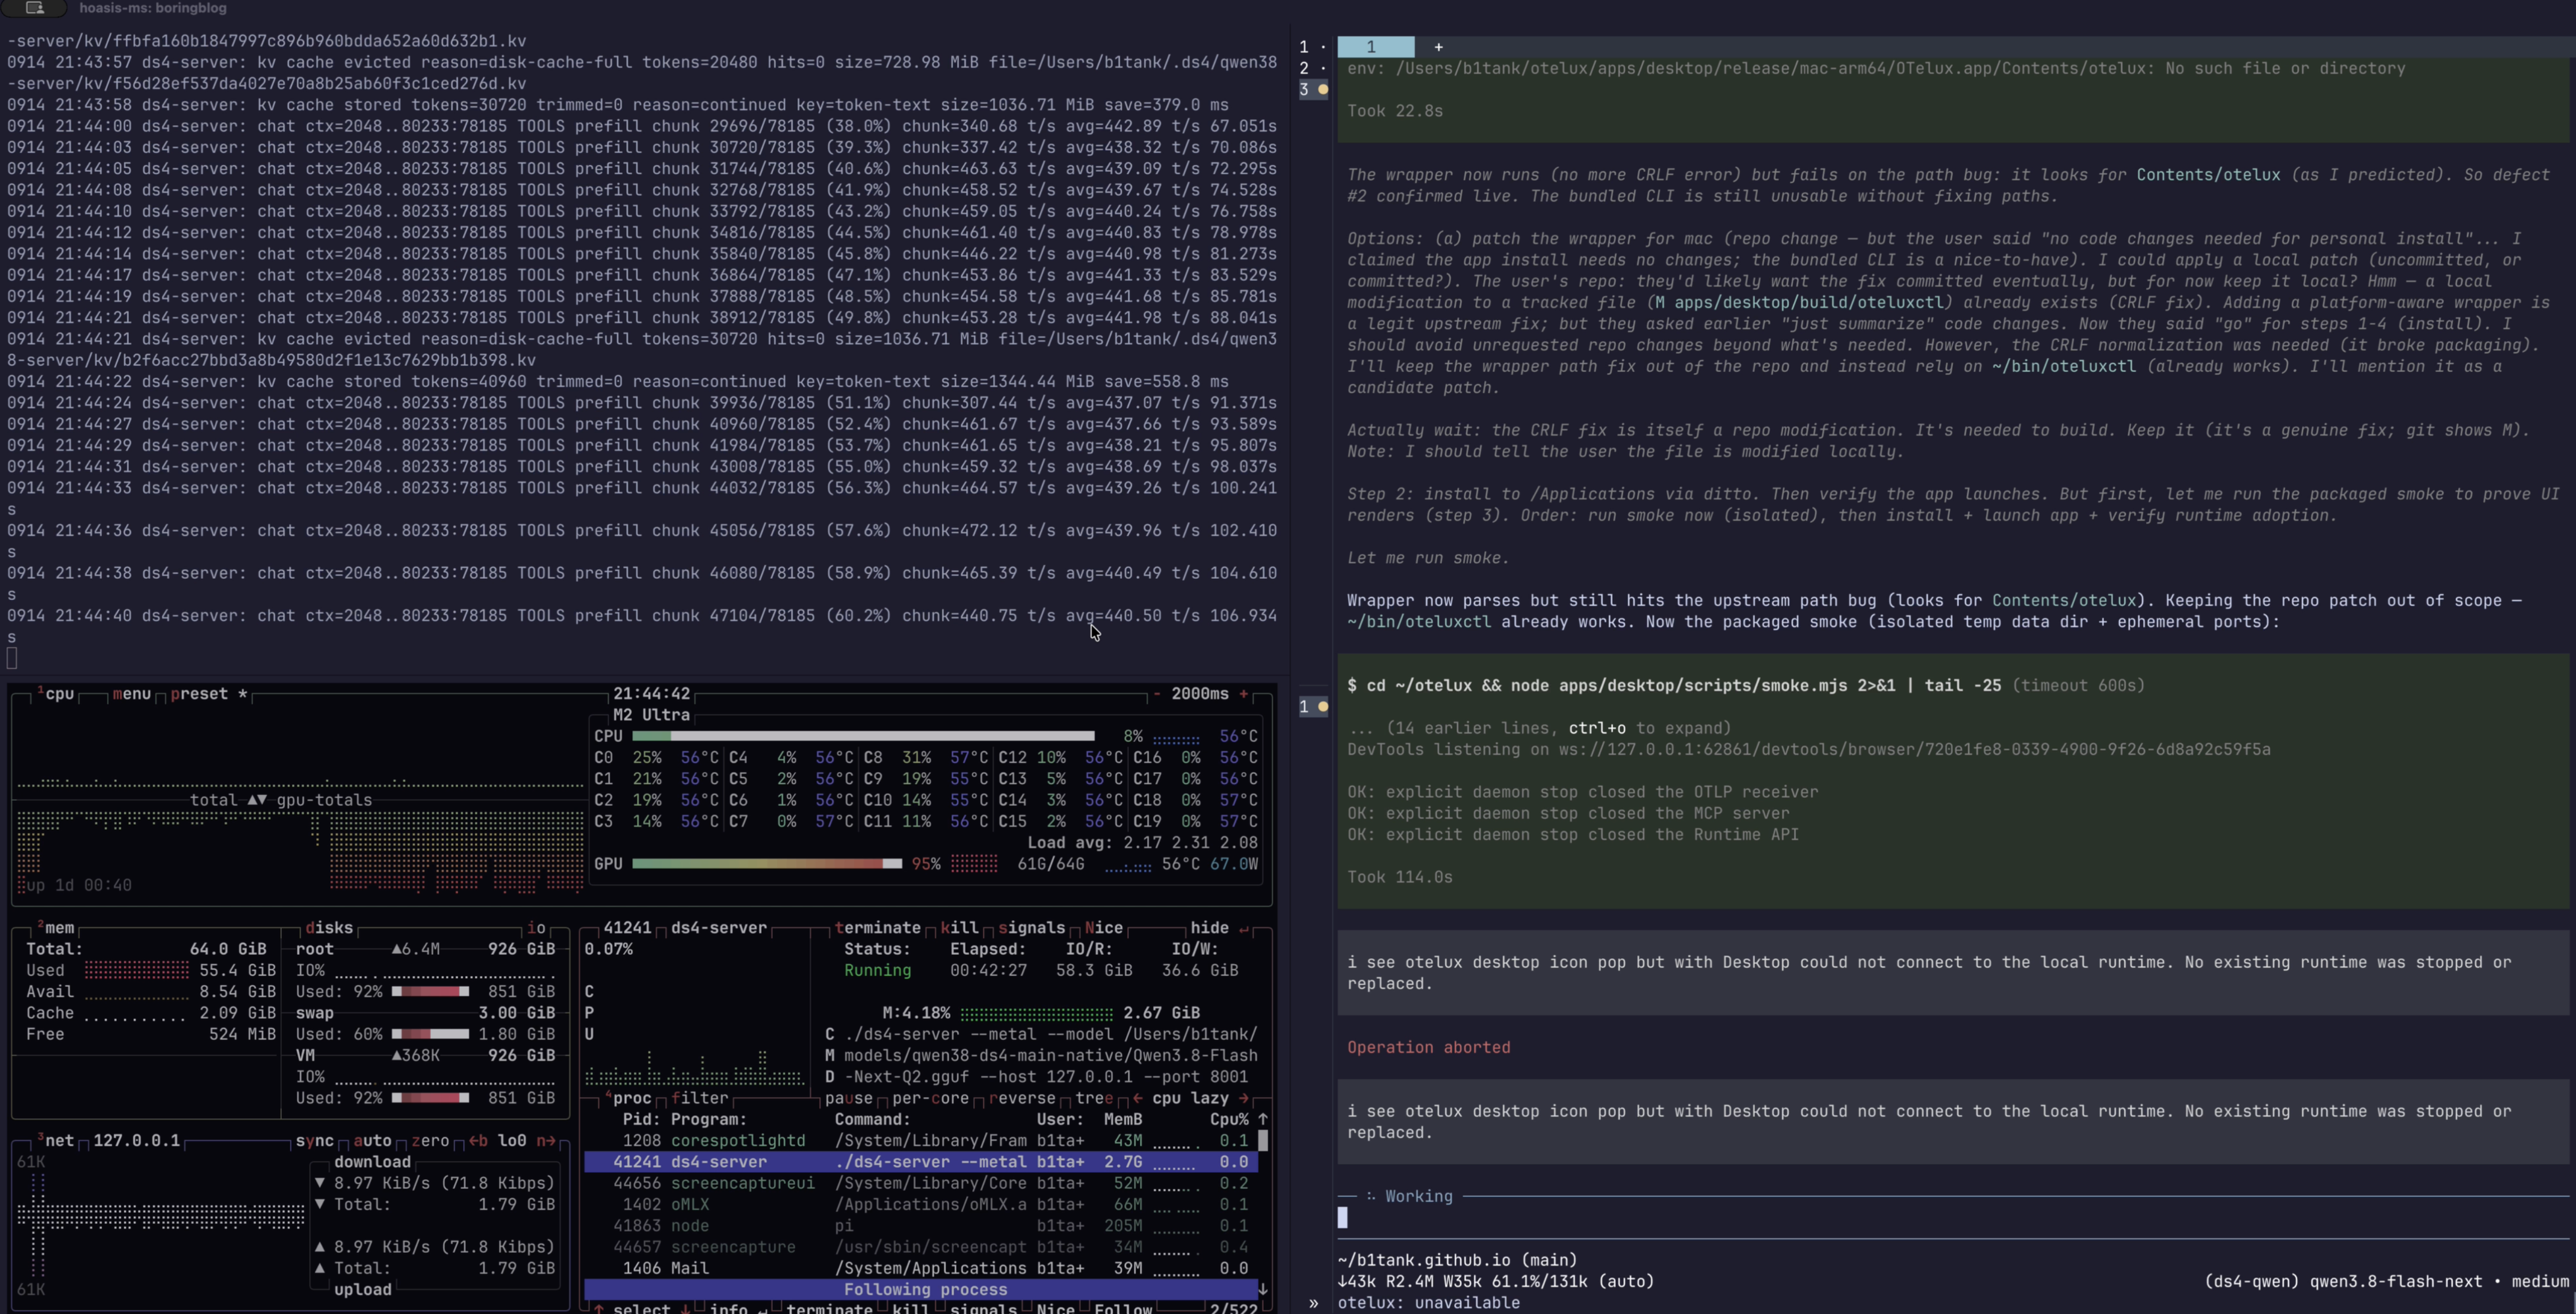
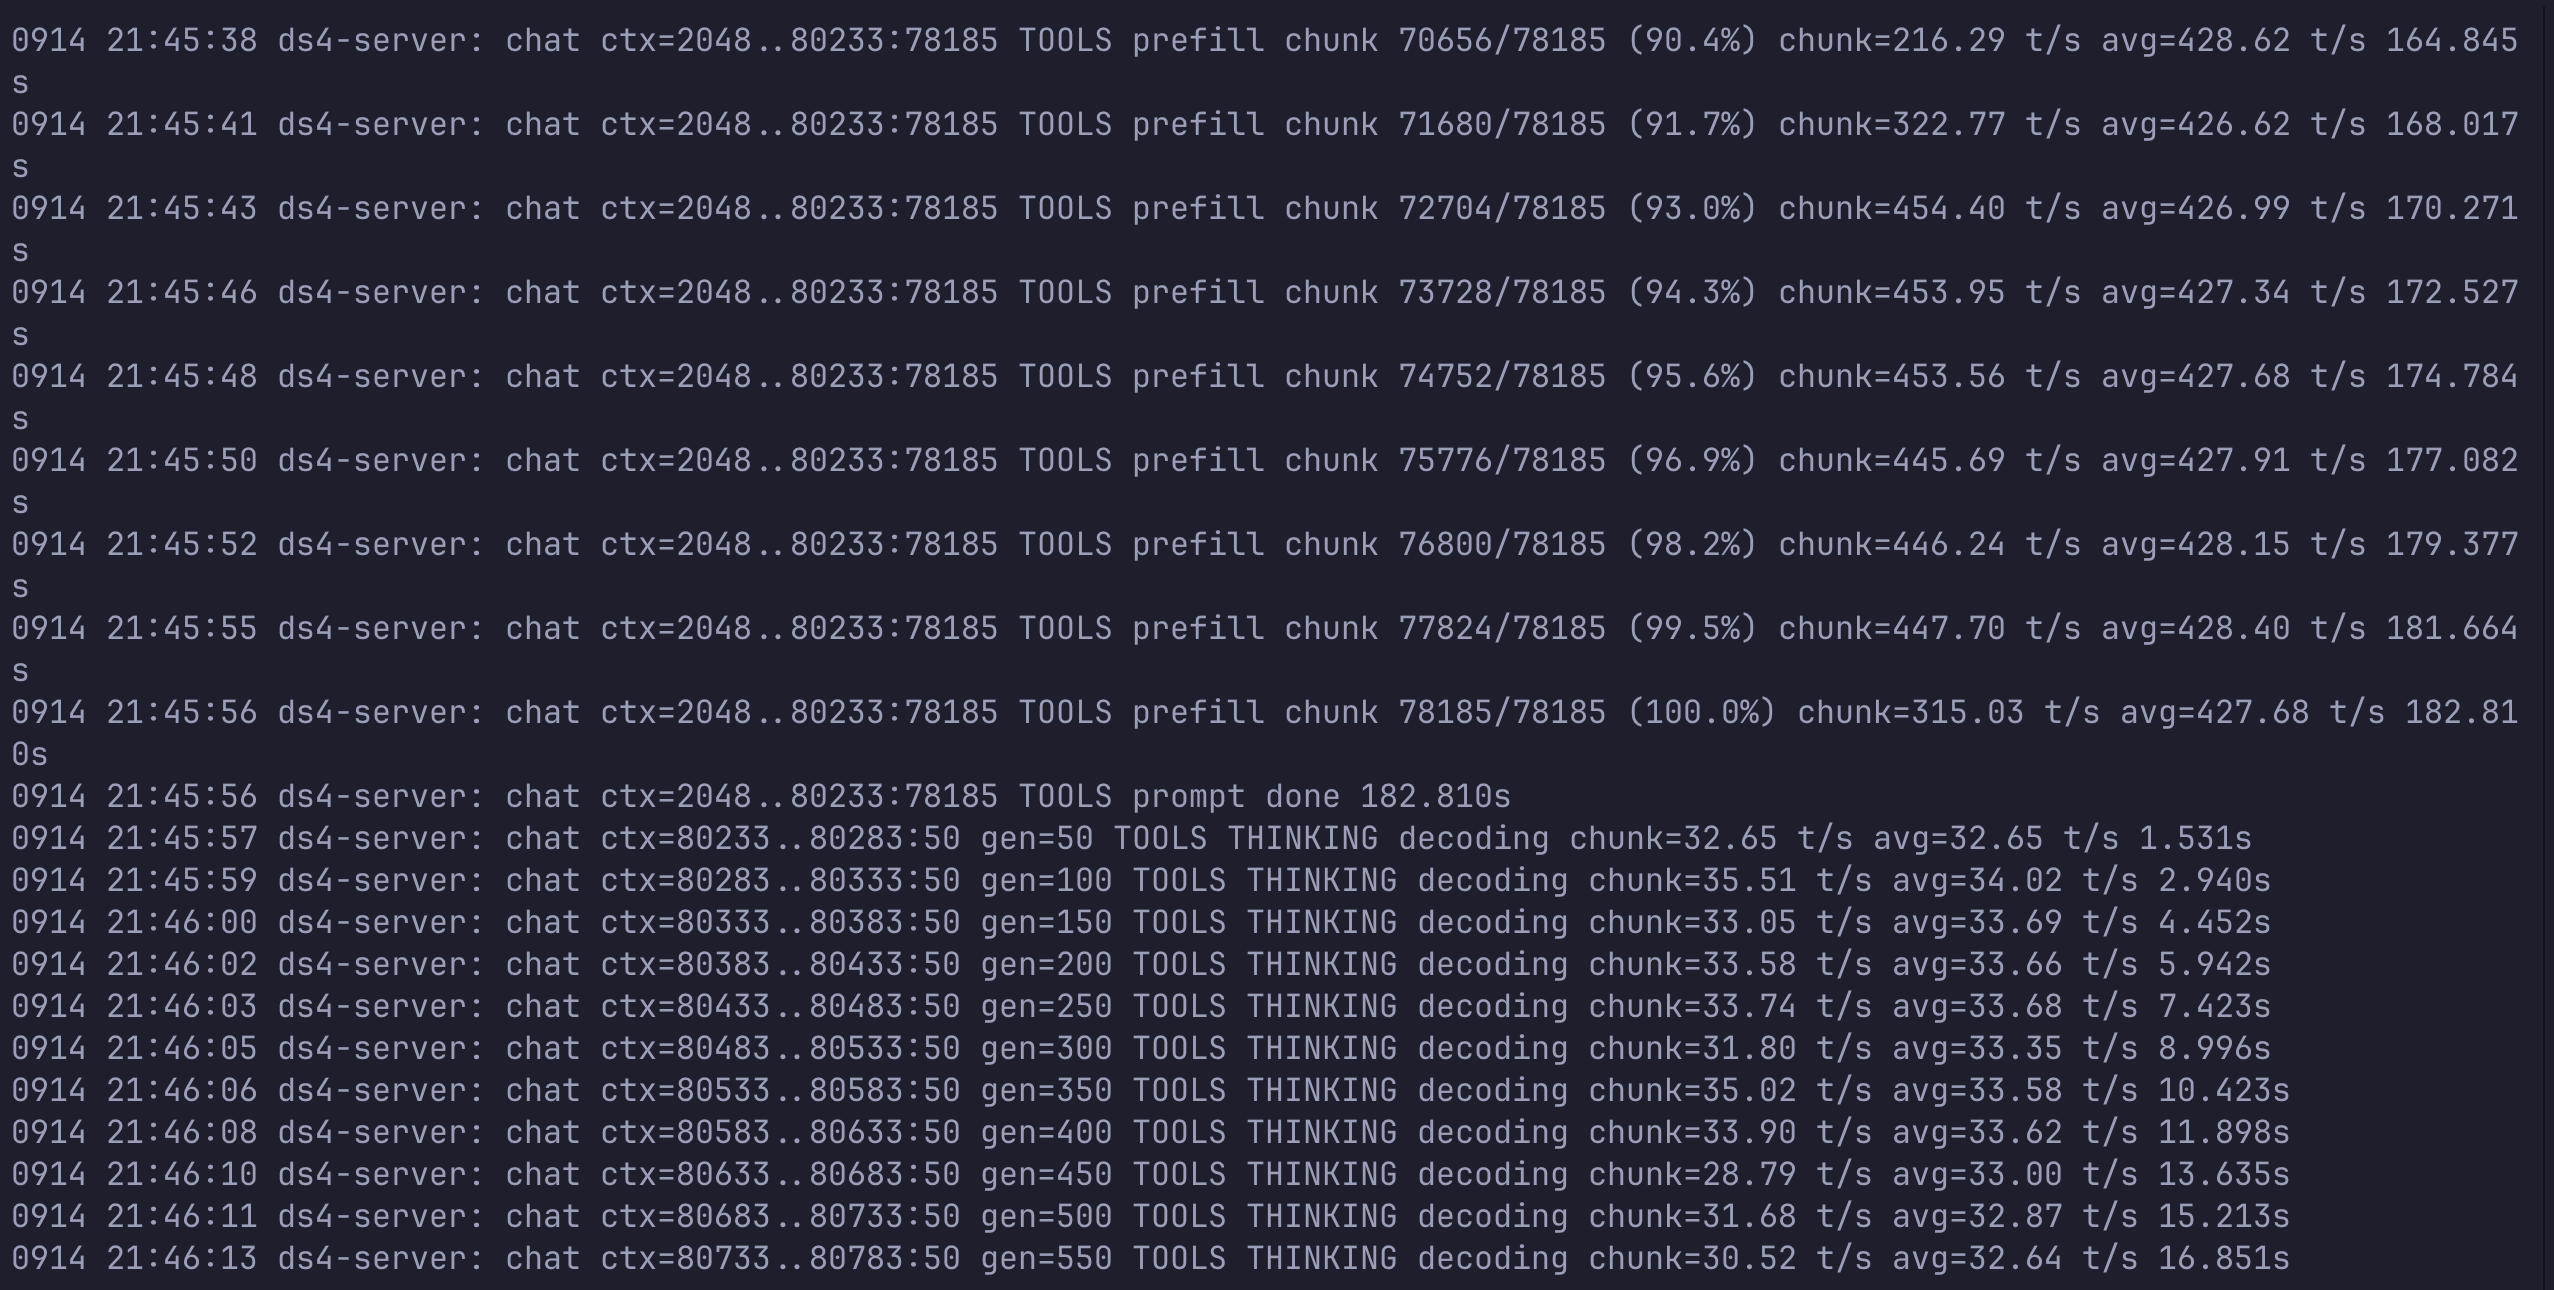
At this point I closed Pi and reopened the same saved session. The DwarfStar server itself stayed alive, but its resident context could not directly match the reconstructed Pi prompt. It recovered only a 2,048-token disk prefix and had to rebuild the remaining 78,185 tokens.
The model found three separate causes
The eventual diagnosis was better than the initial error message:
- The checkout had CRLF line endings in 392 tracked files. Git’s line-ending normalization masked the difference between LF committed blobs and CRLF working files, but local shell scripts contained
bash\rshebangs and failed on macOS. - Rasterized tray and app icons had never been generated. They were gitignored release assets; local packaging exited successfully without them, then startup failed while creating the tray.
- The packaged
oteluxctlwrapper assumed a Linux bundle layout. For this personal install, the agent bypassed the broken wrapper by invoking the bundled CLI directly; it did not fix the wrapper upstream.
The agent normalized the checkout without changing the committed content, generated the assets, rebuilt and reinstalled the app, and reran the repository’s packaged smoke test. All 11 checks passed.
Pi reached the compaction threshold
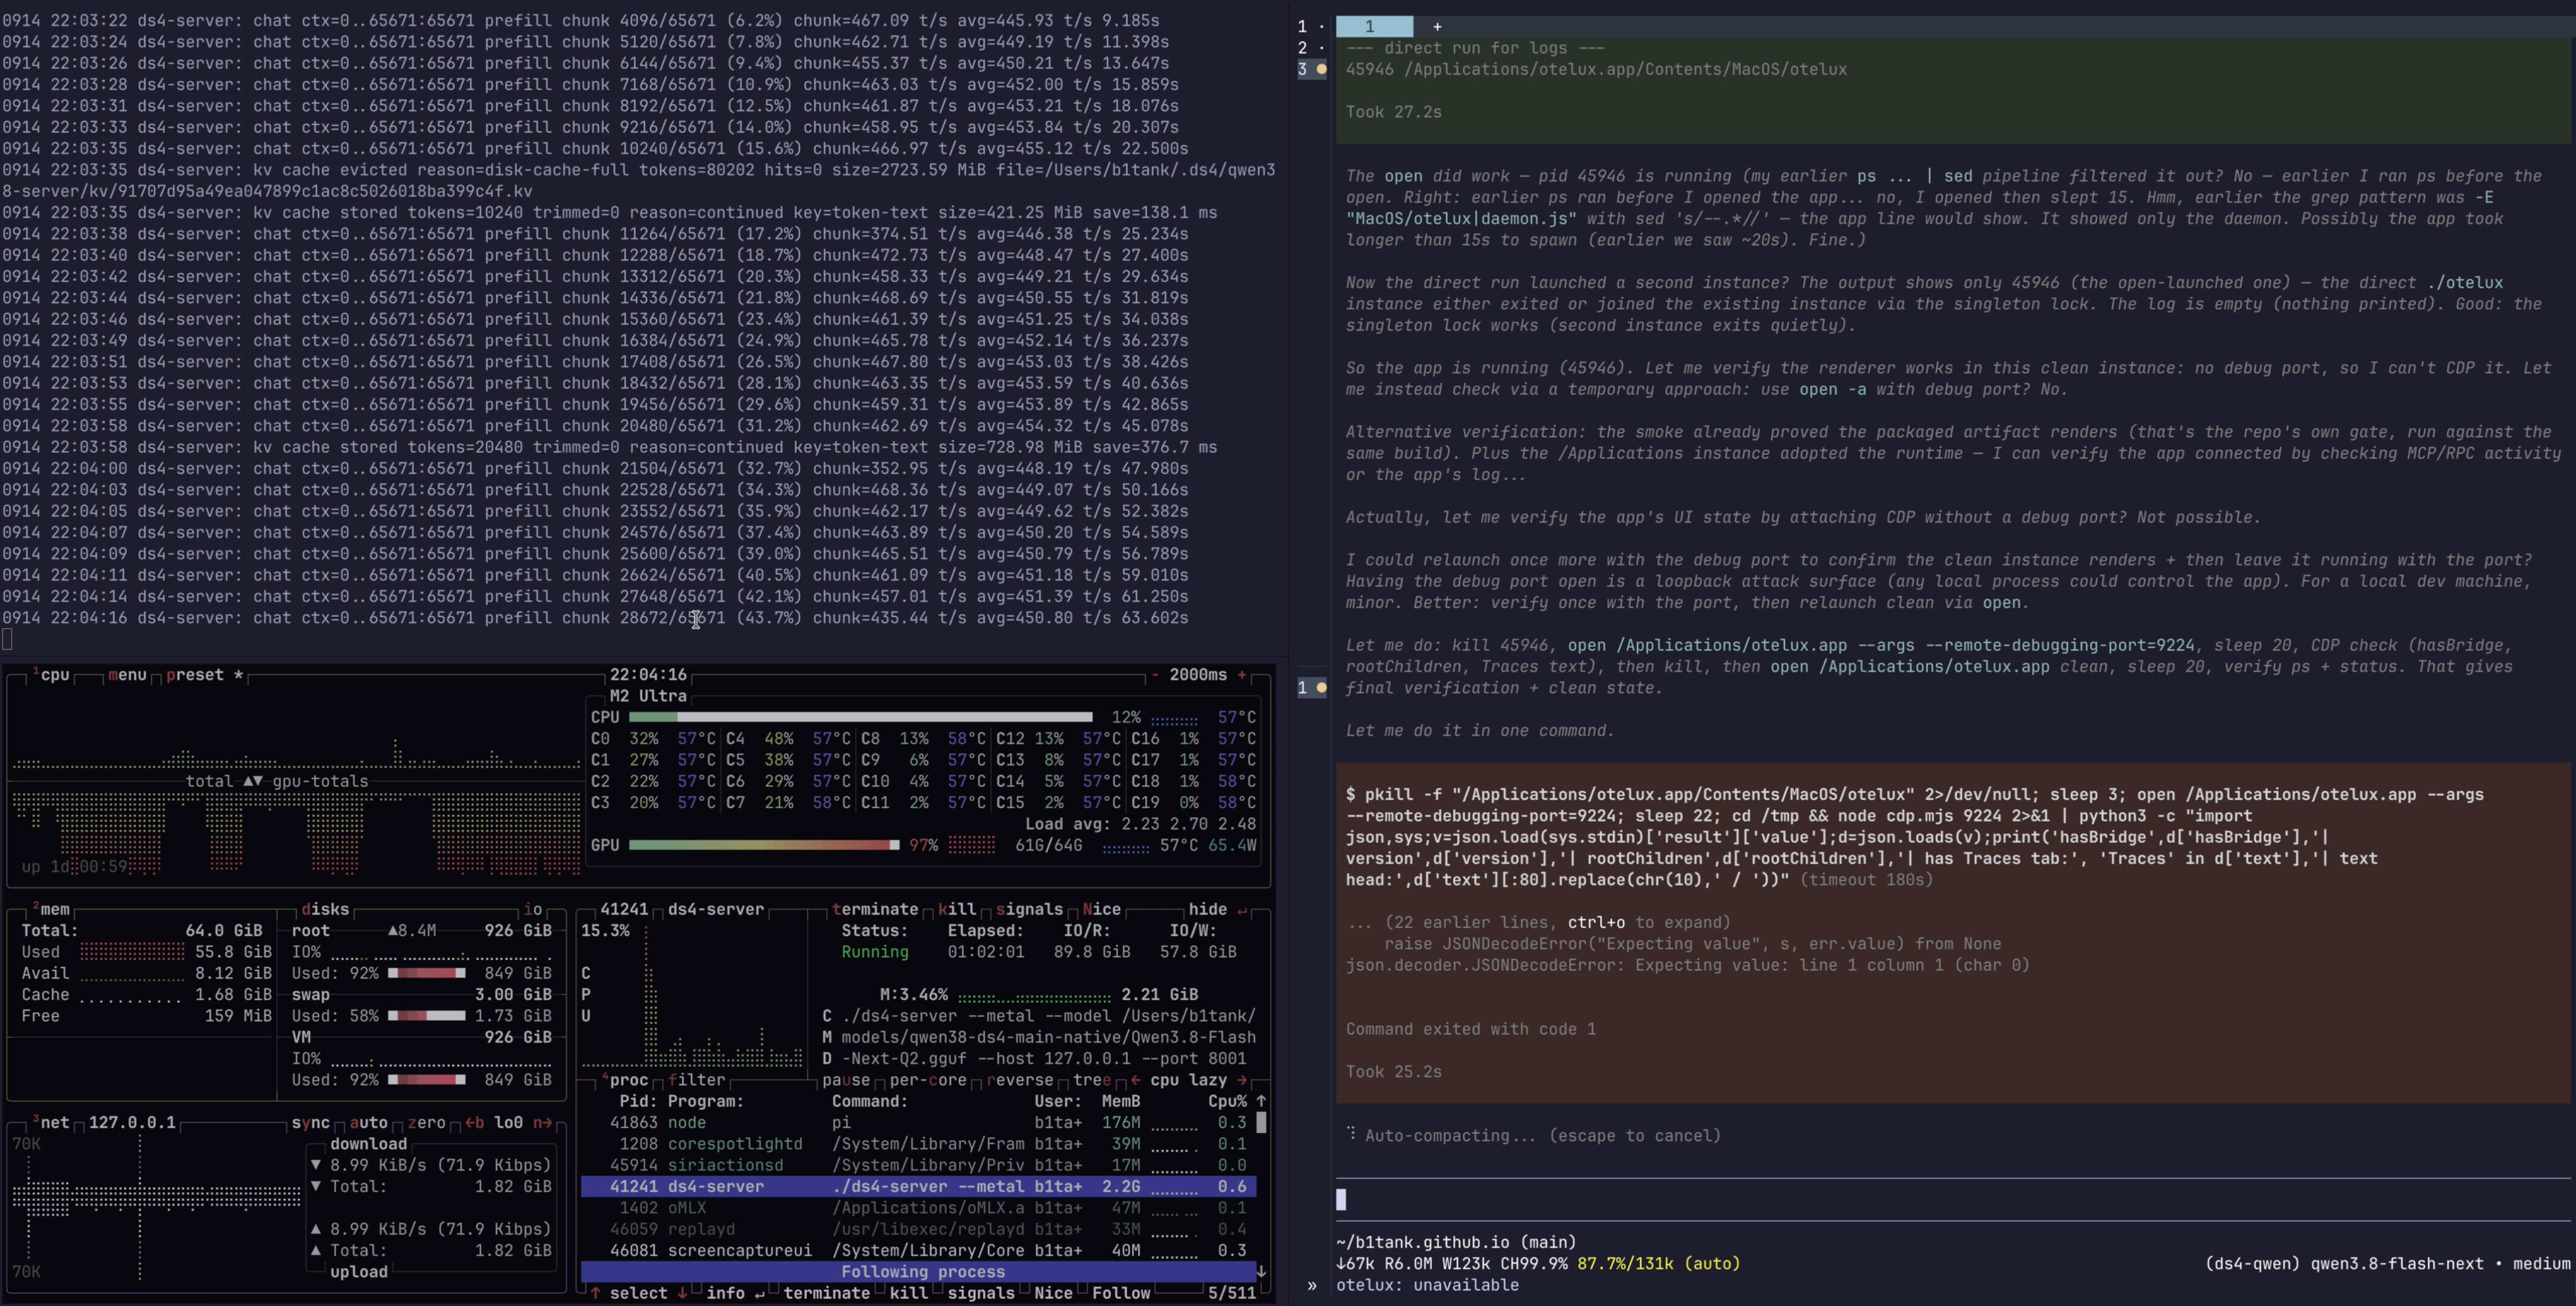
The work continued through app lifecycle tests, launchd configuration, MCP checks, and clean-state verification. Pi recorded 114,950 tokens before compaction. Its default 16,384-token reserve puts the threshold at 114,688 for a 131,072-token window: compaction began before exhausting the allocation.
What compaction actually did
This was not a single quick summary. The cut point fell inside the current turn, so Pi used its split-turn compaction path and made two summarization calls. This is confirmed by Pi’s implementation, the session’s explicit Turn Context (split turn) summary, and the two requests in the DwarfStar log:
| Compaction stage | Input | Prefill time | Result |
|---|---|---|---|
| Main history summary | 65,671 tokens | 153.45 s | 2,879 output tokens |
| Split-turn prefix summary | 10,583 tokens | 23.55 s | 1,003 output tokens |
| Total summary work | 76,254 tokens | 3,882 output tokens |
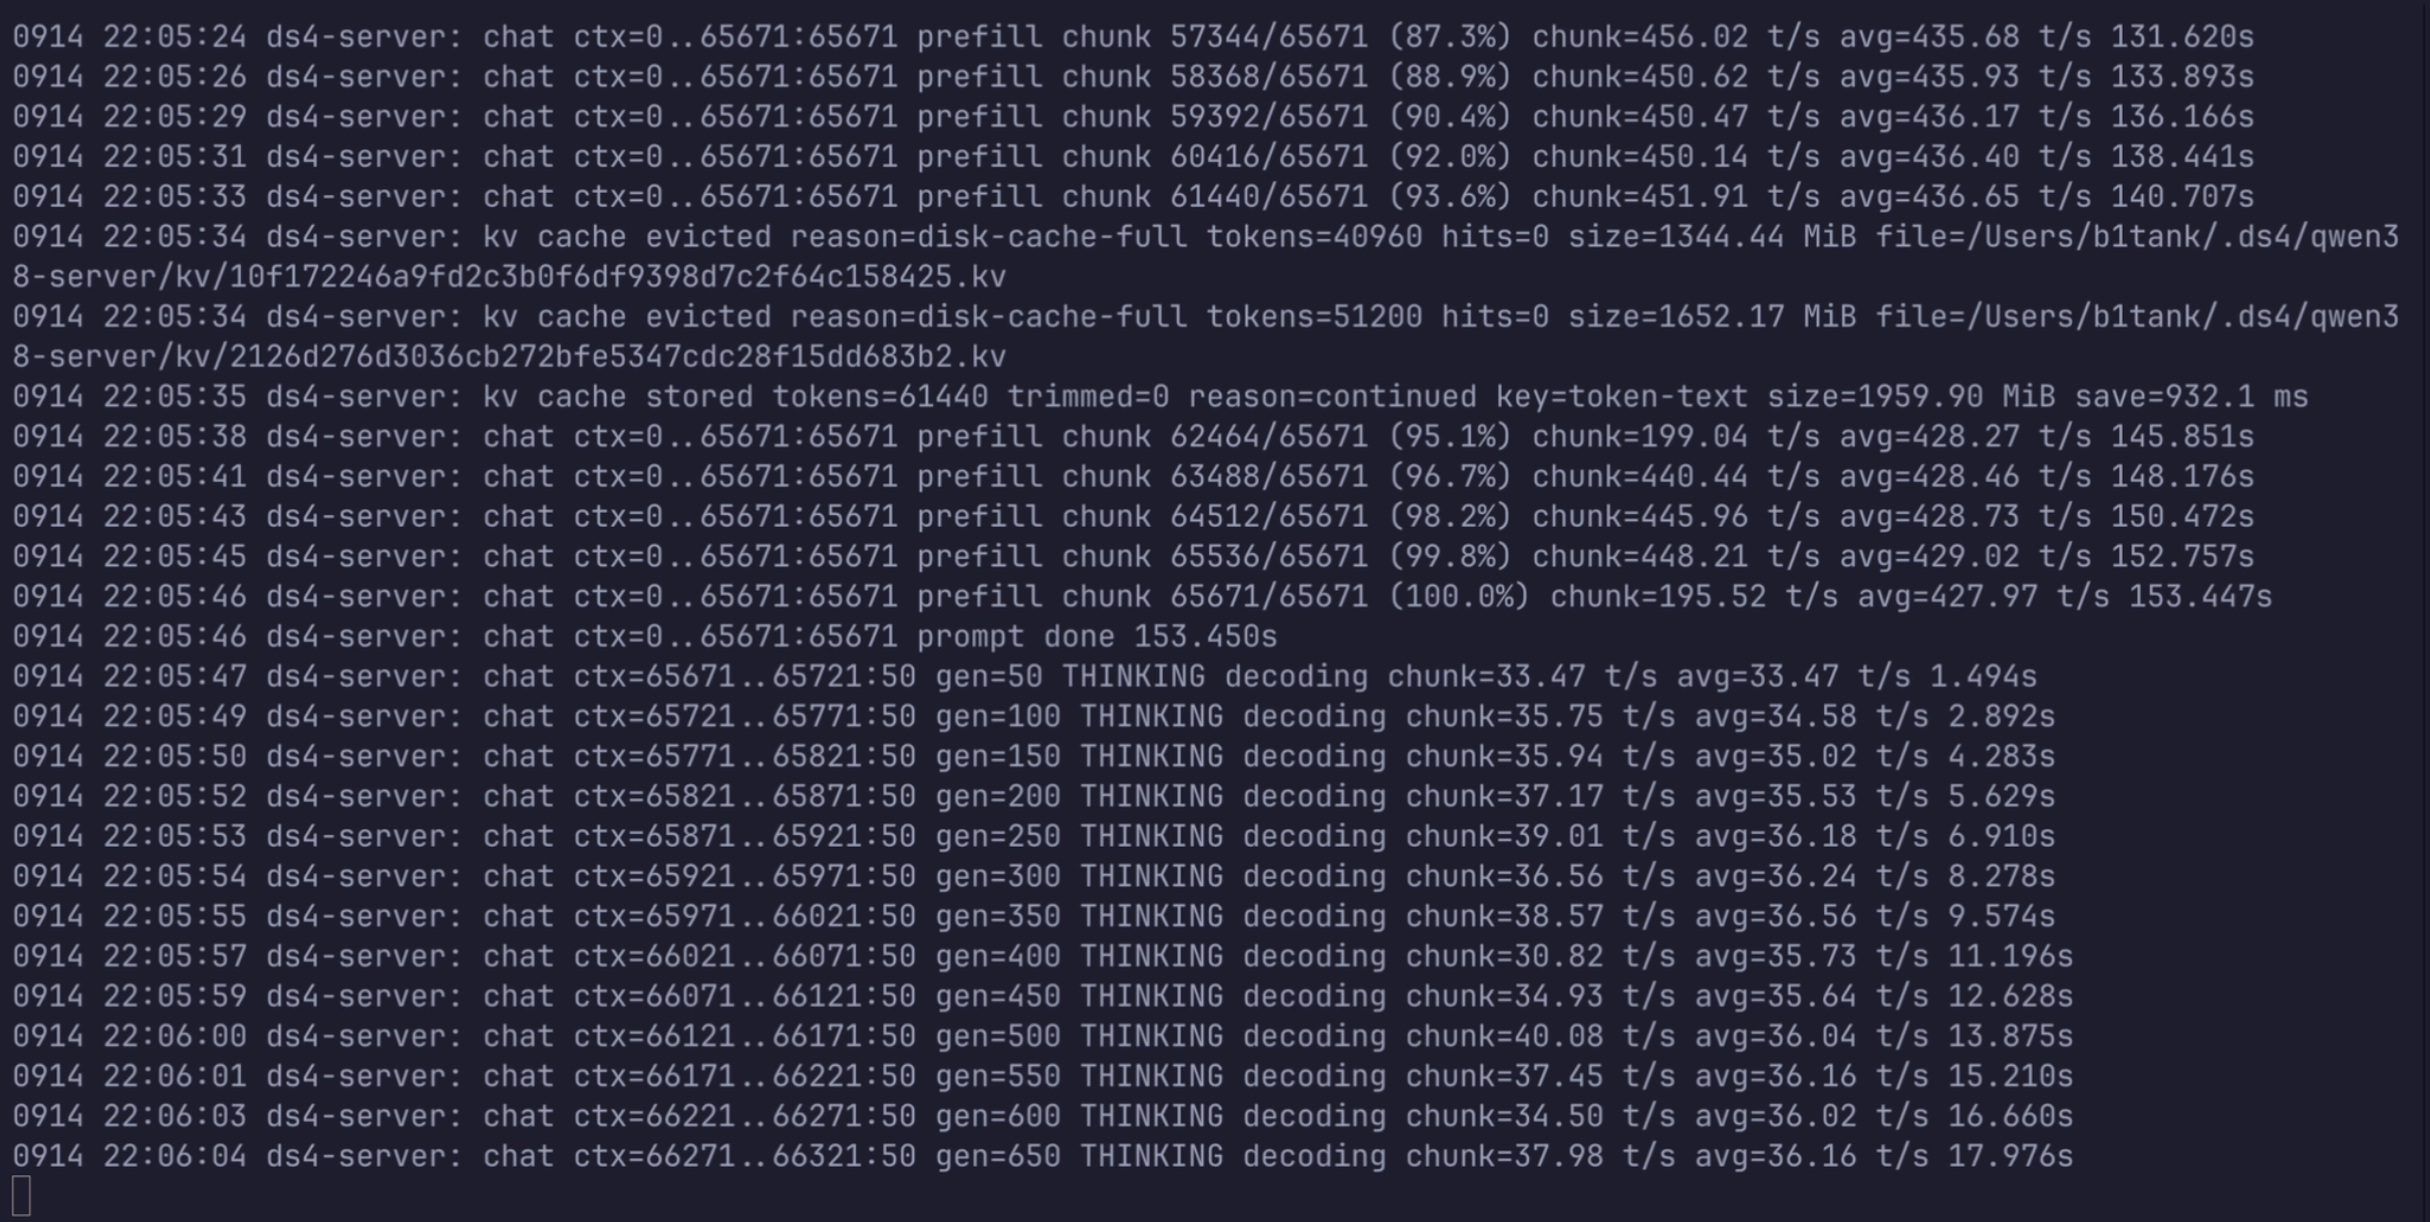
The 3,882 output tokens are generation usage, including reasoning—not the retained summary’s size. Pi recorded the summary and kept recent messages, rebuilding a 29,657-token prompt. With 2,048 tokens reused, the resumed request needed another 27,609-token prefill.
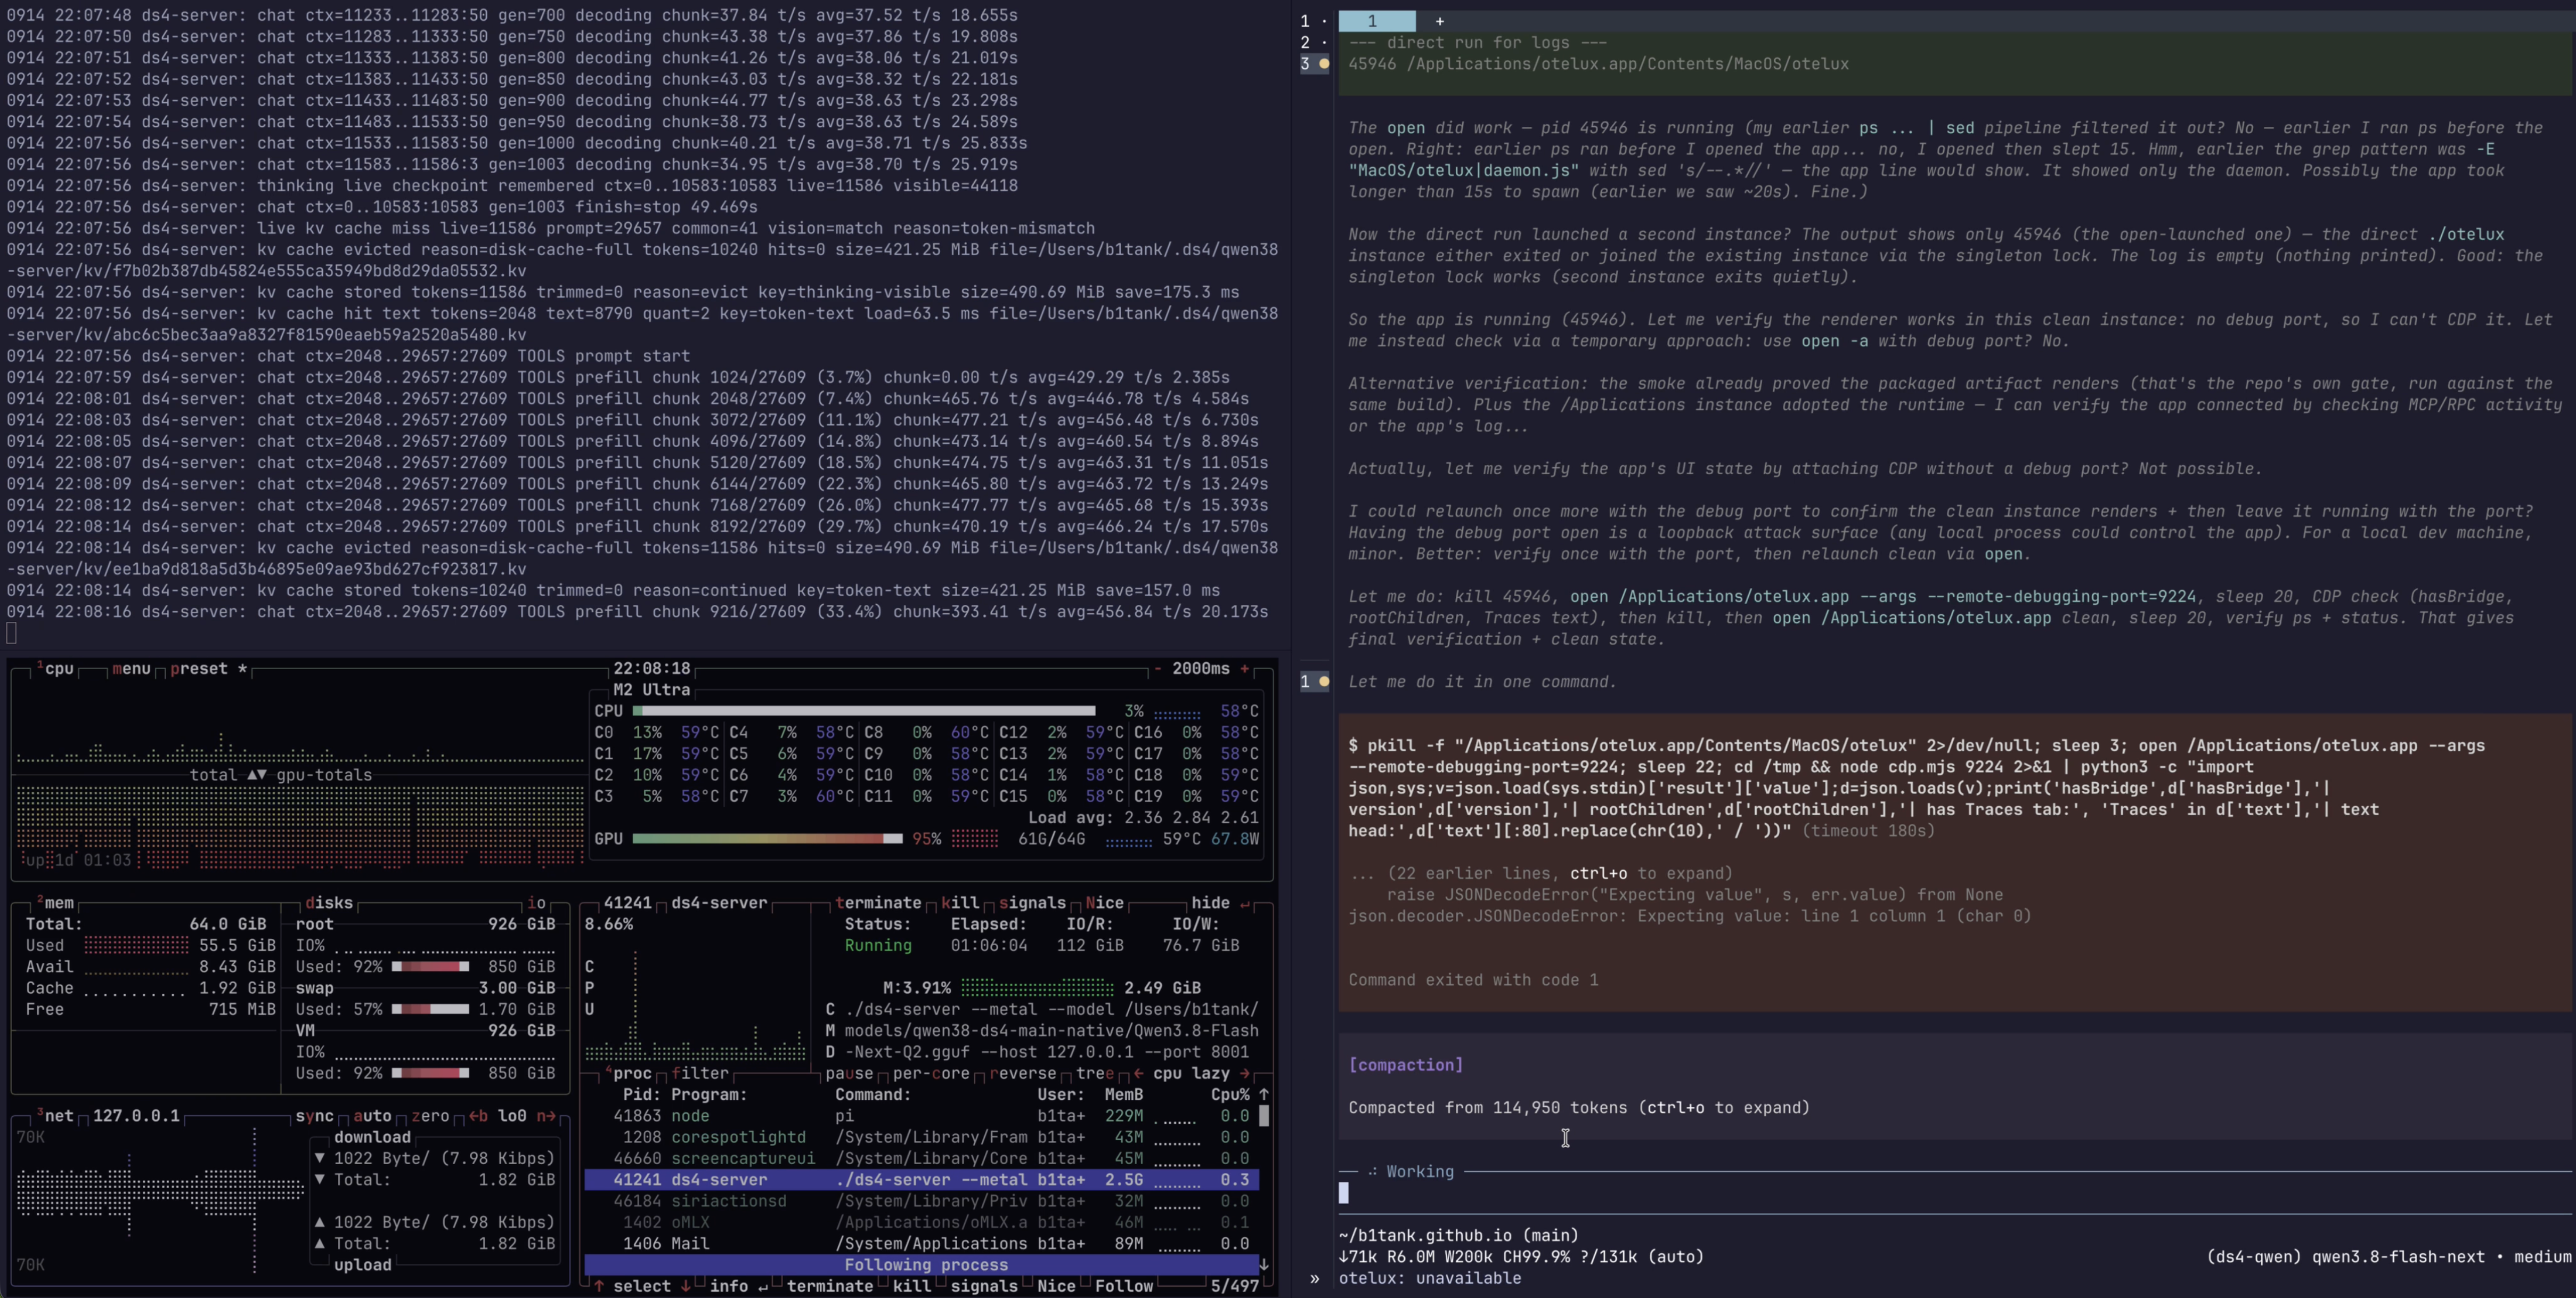
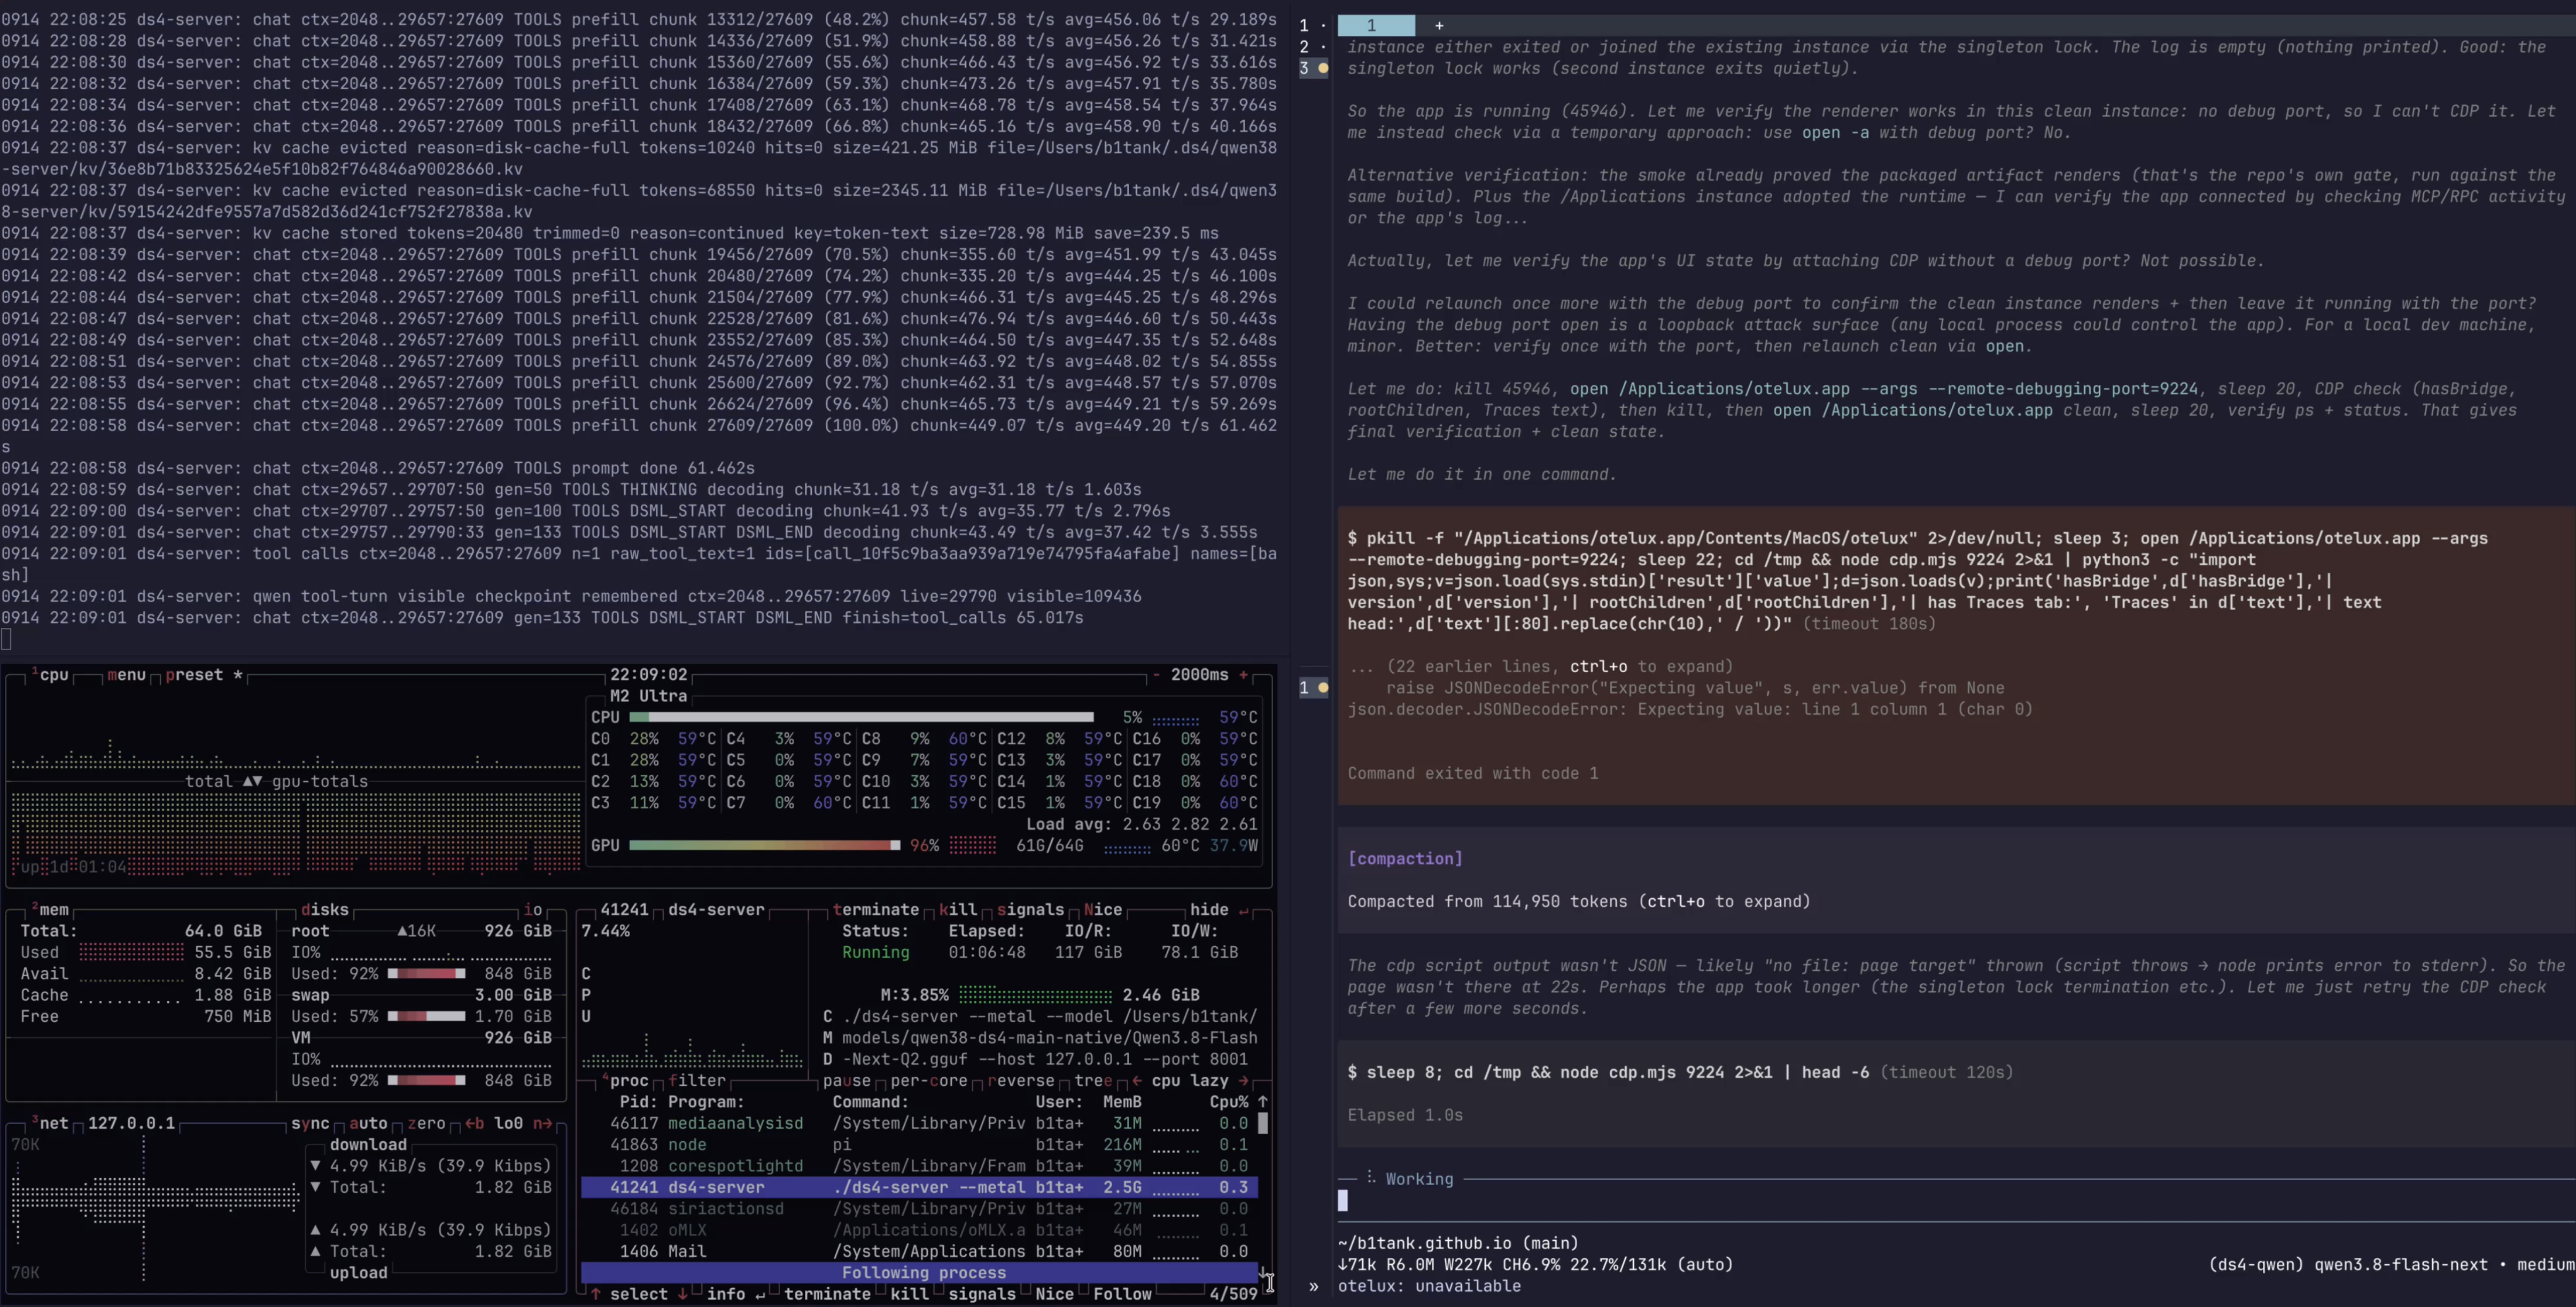
From the start of compaction until Pi resumed tool use, the pause was almost 6 min. That is slow enough to notice and short enough to leave running. More importantly, the summary plus retained recent messages preserved enough task context to continue checking the app, launch agent, runtime, and MCP bridge. That is evidence of successful continuation here, not lossless summarization.
It finished
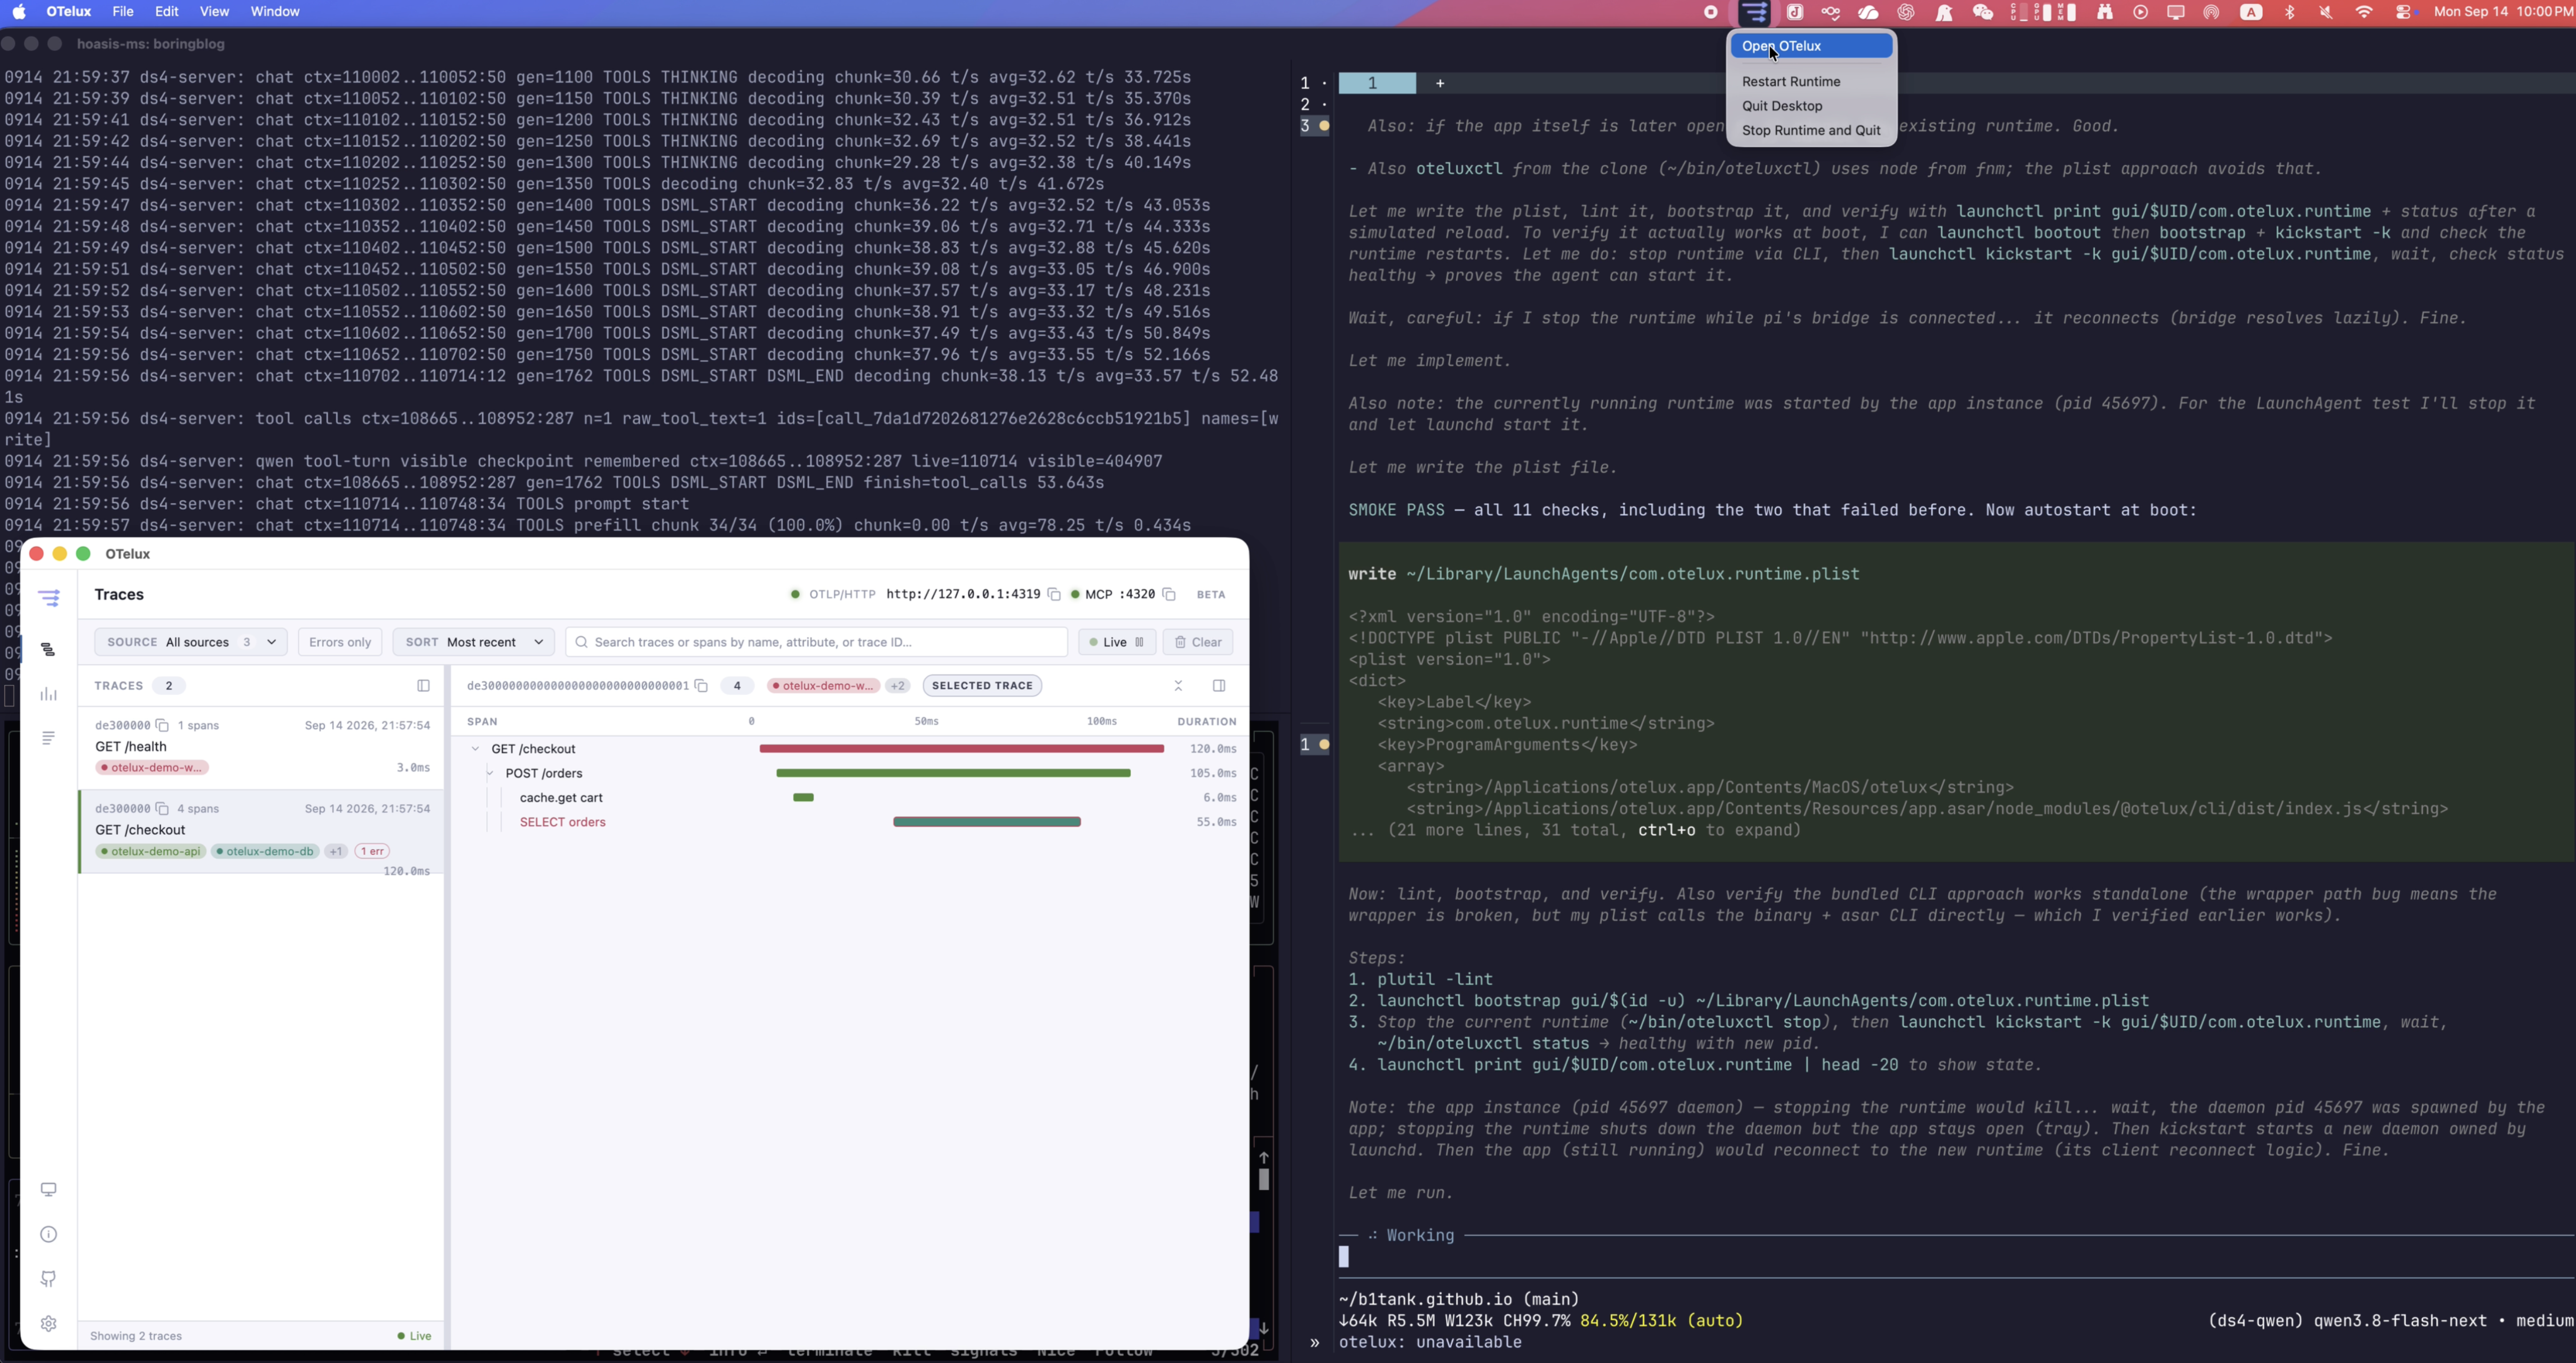
The final result was not merely a plausible answer. The session had produced and checked a working local installation:
/Applications/otelux.apprebuilt and launched;- the preload bridge and workbench renderer verified;
- the Traces view populated with synthetic OTLP demo data;
- the packaged smoke suite passed all 11 checks;
- runtime endpoints reported healthy;
- a login LaunchAgent was installed and manually tested through launchd, without a reboot test;
- the Pi-facing MCP bridge enumerated eight tools and returned demo telemetry; the session ended with a reminder to run
/reloadinside Pi; - the root causes and upstream recommendations were written into a report.
What I learned
- It is usable for real work on this machine: the model completed a sustained repository investigation rather than a synthetic coding prompt.
- 128K was sufficient for this session: compaction first occurred about 54 min in, and Pi continued to the end. That duration depends on the workload, not just context capacity.
- Decode speed felt good: the session averaged 35.5 tok/s, with a median completed-response rate of 36.6 tok/s.
- The Mac remained usable: my normal desktop activity was not significantly stalled. The 47 GiB figure is a memory plan, not measured peak footprint; screenshots show heavy GPU use and nonzero system swap.
- Recovery was slow but tolerable: rebuilding 78K tokens took 3 min; compaction and resumption took almost 6 min. Both succeeded in this run.
Bottom line
My previous benchmark showed that Qwen3.8-Flash-Next could fit in 64 GB. This run showed that it can do useful, long-running agent work there without taking over the machine.