An Opinionated Map of LLM Observability
I compare LLM observability products through five things:
- instrumentation
- export
- authentication
- client
- storage
This structure makes me look past the screenshots and ask how telemetry actually travels from an application to a place where I can investigate it. I use it here to compare Langfuse, Phoenix, and Application Insights.
This is a personal map, not a feature ranking. These products change quickly, and each one covers more than the narrow path described here.
Start with the path
OpenTelemetry separates instrumentation from the backend. An application creates traces, metrics, or logs, then exports them to a collector or backend. OpenTelemetry defines the APIs, protocol, and conventions, but it does not provide the storage and investigation UI itself.1
For an LLM application, I find it helpful to trace this path:
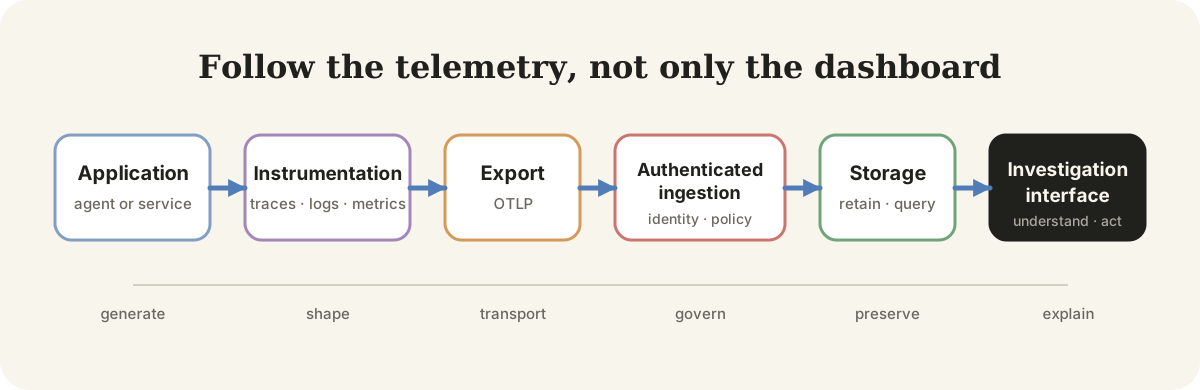
At its simplest, an instrumented application only needs to know where to send OTLP and how to identify itself:
export OTEL_EXPORTER_OTLP_ENDPOINT=http://localhost:4318
export OTEL_SERVICE_NAME=my-agent
The backend may require a different endpoint path, protocol, or authentication header, but these two variables show the basic separation between the application and its destination.
Logfire is one possible instrumentation layer. OpenInference adds AI-oriented conventions and instrumentation on top of OpenTelemetry. Those are choices near the application. Langfuse, Phoenix, and Application Insights are destinations with different product and deployment shapes.
Langfuse
For Langfuse, I can instrument with Logfire, export OpenTelemetry directly to Langfuse, use a web and worker deployment, and store data in Redis, ClickHouse, PostgreSQL, and object storage. That captures the main self-hosted shape, although Langfuse now documents its own OpenTelemetry-native SDKs as the preferred path for Python and JavaScript.
Langfuse accepts traces through an OTLP endpoint. Direct OTLP ingestion uses project API keys through a Basic Authentication header. For self-hosting, the documented architecture includes two application containers:2
- Langfuse Web serves the UI and APIs.
- Langfuse Worker processes events asynchronously.
The storage layer is deliberately split. PostgreSQL handles transactional data, ClickHouse stores traces and analytical data, Redis or Valkey supports queues and caching, and S3-compatible blob storage persists incoming events and larger objects.
That is a capable architecture, but it is also several pieces to operate. I would consider the managed service when I want the Langfuse product without owning those components. I would consider self-hosting when control over the data path and infrastructure matters enough to justify the work.
Phoenix
For Phoenix, the path is smaller: instrument with OpenInference, export through OpenTelemetry, run a single container, and use PostgreSQL.
Phoenix is still the easiest of these three for me to picture as one local unit. Its self-hosted server includes both a web UI and an OTLP trace collector. The configuration reference documents OTLP over HTTP and gRPC.3 It can start with SQLite for a small local setup or connect to PostgreSQL for a more durable deployment.
OpenInference is central to the Phoenix ecosystem. It provides conventions and instrumentation for LLM calls, retrieval, tool use, and agent frameworks while remaining compatible with OpenTelemetry backends. That means OpenInference instrumentation is not limited to Phoenix, even though Phoenix supports it directly.
The simple container shape makes Phoenix appealing for local investigation and a first self-hosted deployment. Authentication and production topology still need explicit configuration before exposing it beyond a trusted environment.
Application Insights
For Application Insights, I can instrument with Logfire, export with a local OpenTelemetry exporter, authenticate with a connection string, investigate in the Azure portal, and let Azure manage storage.
The current Microsoft guidance recommends the Azure Monitor OpenTelemetry Distro for supported server-side applications.4 The distro collects traces, metrics, logs, and exceptions, then sends them to an Application Insights resource. A connection string identifies the destination. Access to the data and portal experiences is handled through Azure.
Application Insights is different from the two self-hosted products because I do not assemble its storage layer. Azure Monitor provides the backend and investigation experiences, including application maps, transaction search, failures, performance views, logs, metrics, alerts, and dashboards.
This is attractive when the application already runs in Azure or when I want a managed operational backend. It also places the telemetry inside the wider Azure Monitor model, which may be more product than a small local LLM experiment needs.
What this became in practice
This map later became practical in my own work. In VS Code and GitHub Copilot, I worked on GenAI instrumentation, local SQLite trace storage and OTLP forwarding, enterprise-managed OpenTelemetry settings, and native Agent Host telemetry with trace-context propagation.5 The five layers were no longer abstract categories. A decision during instrumentation affected export, storage, access, and the investigation experience downstream.
The part I enjoy most is making a software trajectory visible. A static diagram can explain architecture, but a live trace shows the system in motion: which model ran, which tool it called, where time was spent, what failed, and how the work branched. I want that view to be understandable in real time and exportable as a self-contained HTML report that can be inspected or shared later.
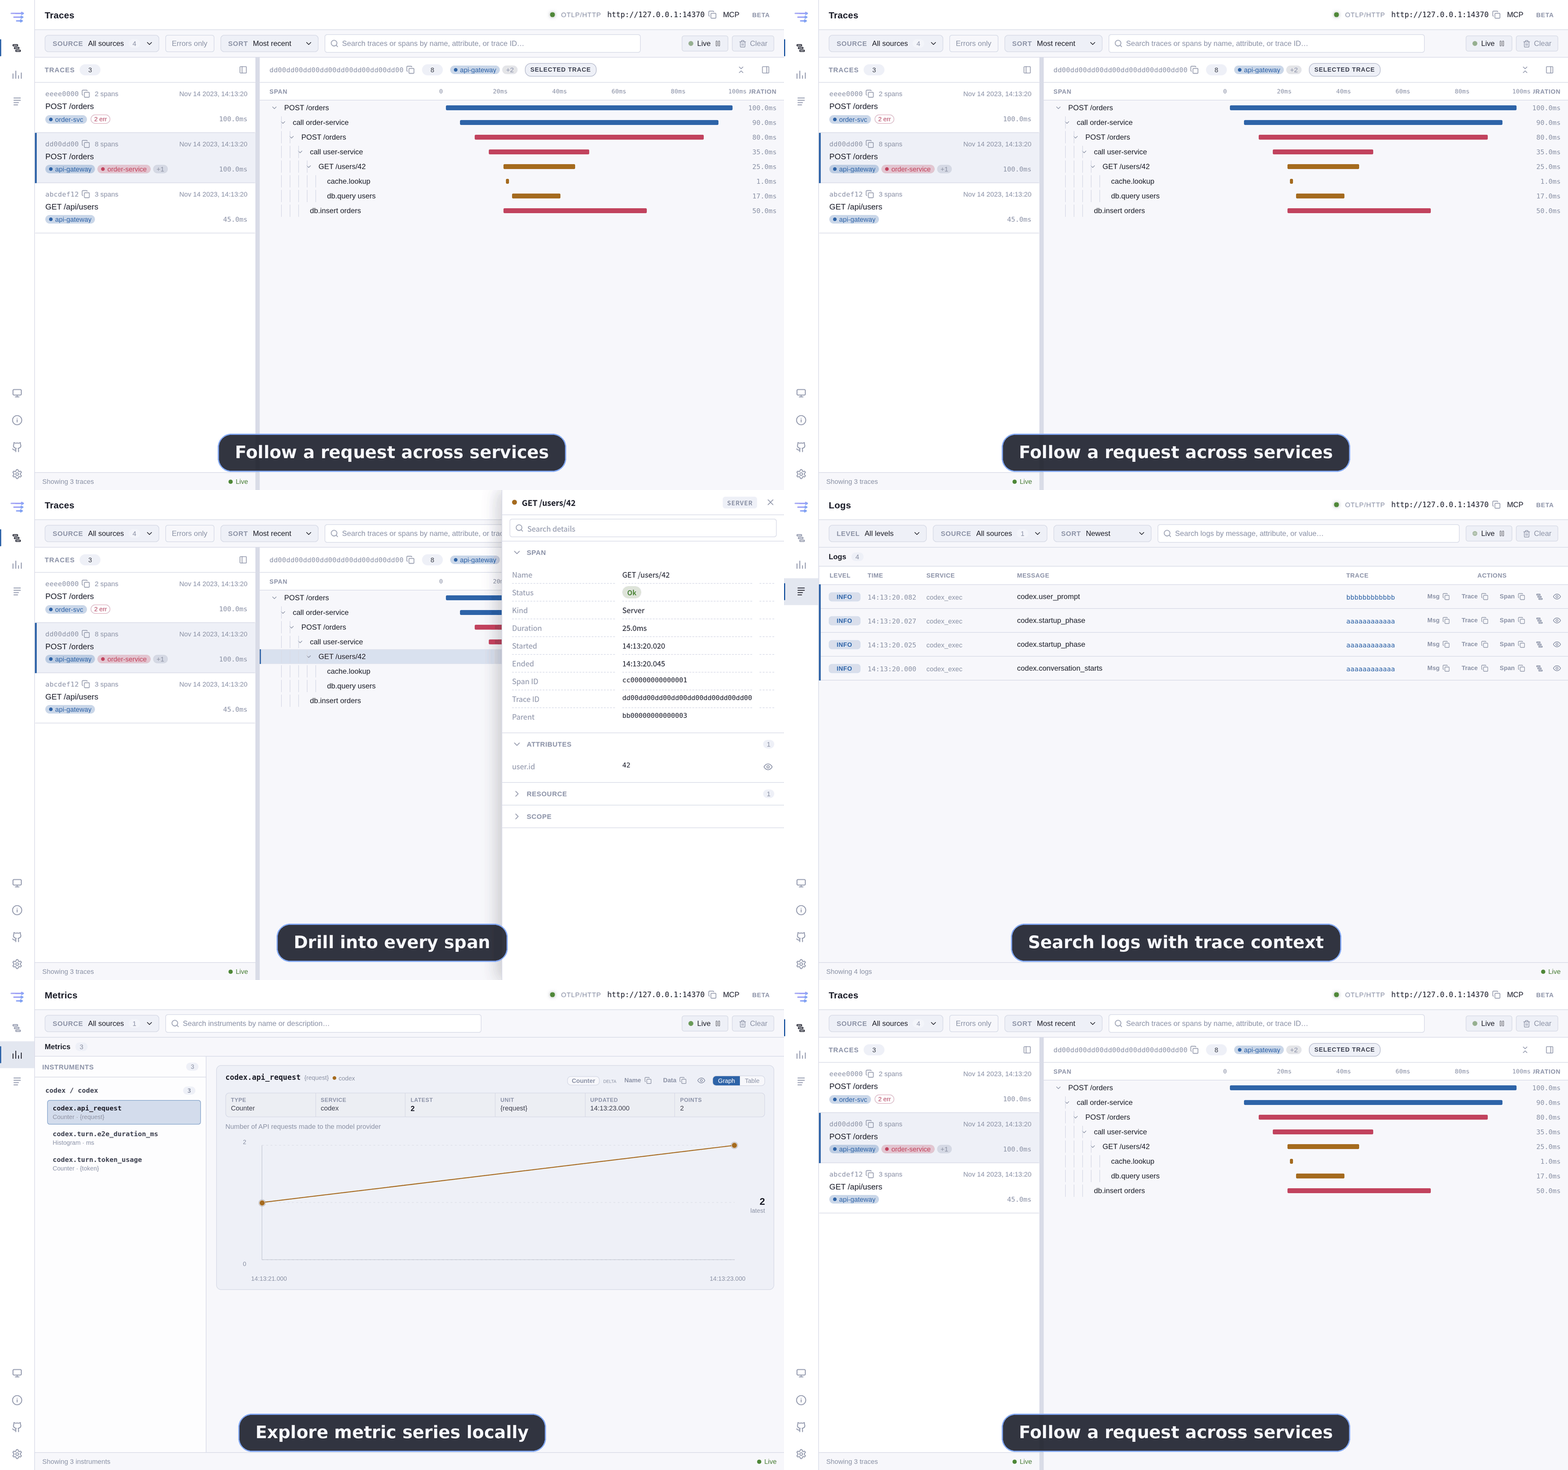
LLM observability also needs a content boundary. A trace may contain prompts, system instructions, tool arguments, command output, file contents, and repository information. Exporting the trace successfully does not mean every field should be captured. Work such as filtering repository telemetry through content exclusion made that boundary explicit.6 Content exclusion, bounded payloads, and opt-in capture need to be considered across the whole path.
The public VS Code agent monitoring guide shows how to enable collection and send the resulting OpenTelemetry signals to a compatible backend.7
The compact comparison
| Layer | Langfuse | Phoenix | Application Insights |
|---|---|---|---|
| Instrumentation | Logfire or OpenTelemetry | OpenInference | Logfire or Azure Monitor OpenTelemetry |
| Export path | OTLP/HTTP to Langfuse | OTLP/HTTP or OTLP/gRPC | Azure Monitor exporter or distro |
| Ingestion identity | Project API keys | Configured instance authentication | Application Insights connection string |
| Main client | Langfuse web application | Phoenix web application | Azure portal and Azure Monitor tools |
| Self-hosted storage | PostgreSQL, ClickHouse, Redis/Valkey, blob storage | SQLite or PostgreSQL | Managed by Azure Monitor |
| Deployment shape | Web, worker, and storage services | All-in-one server plus chosen database | Managed Azure service |
The table does not pick a winner. It tells me what I would be agreeing to operate.
For a quick local trace viewer, Phoenix has a clear starting shape. For an LLM-focused product with prompt, evaluation, and analytics workflows, Langfuse provides a broader dedicated system. For an application already living in Azure, Application Insights connects LLM telemetry with the rest of application operations.
The main lesson is simple: do not compare only the UI. Follow the data from instrumentation to export, authentication, storage, and finally the client where someone will investigate it.
Footnotes
-
OpenTelemetry, What is OpenTelemetry?. ↩
-
Langfuse documentation for OpenTelemetry ingestion and self-hosting architecture. ↩
-
Arize Phoenix, Self-hosting configuration. ↩
-
Microsoft Learn, Enable Azure Monitor OpenTelemetry. ↩
-
Implementation references: GenAI instrumentation, local SQLite storage and OTLP forwarding, enterprise OpenTelemetry settings, and Agent Host telemetry and trace context. ↩
-
VS Code, filter repository telemetry through content exclusion. ↩
-
VS Code documentation, Agent monitoring. ↩